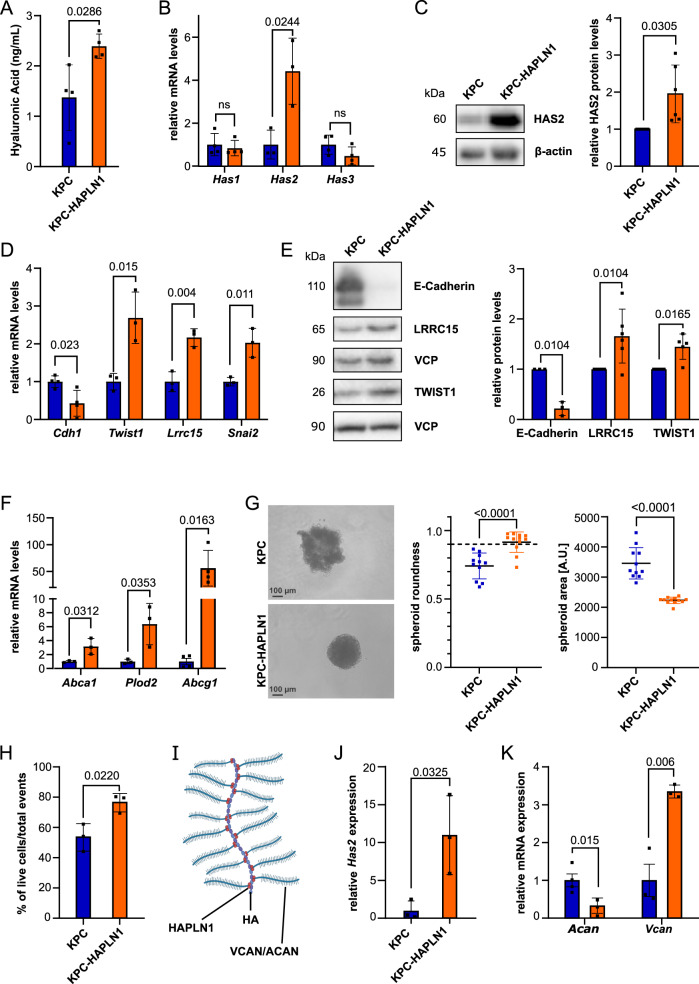
Fig. 2. HAPLN1 induces EMT and ECM remodeling in vitro.
A ELISA-like assay for Hyaluronan (HA) in the serum-free supernatant of KPC and KPC-HAPLN1 cells. n = 4. B qRT-PCR analysis of HA-synthase (Has) expression levels. HAS1 & HAS3, n = 3: HAS2, n = 4. C HAS2 protein levels evaluated by Western blot. Left panel: representative image, right panel: quantification by normalization to house keeper β-actin. n = 6. D mRNA expression of epithelial and mesenchymal markers comparing KPC and KPC-HAPLN1 cells. Cdh1, n = 4; rest, n = 3. E Western blot analysis of epithelial and mesenchymal markers on protein lysates. Left panel: representative image, right panel: quantification by normalization to house keeper VCP. E-Cadherin, n = 3; rest, n = 6. F mRNA expression of stemness markers by qRT-PCR. Abcg1, n = 4; rest, n = 3. G Cells seeded in ultra-low attachment plates. Pictures taken after 48 h. Quantification of area as measure for proper spheroid formation. Scale bar: 100 µm. KPC, n = 11; KPC-HAPLN1, n = 12. H Flow cytometric analysis of DAPI− events using spheroids formed for 48 h. n = 3. I Schematic overview of HAPLN1 function as crosslinker of HA and proteoglycans aggrecan (ACAN) or versican (VCAN). J, K Gene expression analysis of Has2, n = 3 (J) and HAPLN1-associated proteoglycans (K) in spheroids. Vcan, n = 3; Acan, n = 4. Plots are shown as mean ± SD. Data points represent independent biological replicates. For panels A, B, D, F–J unpaired two-tailed T test was applied, for panels C, E paired two-tailed T test.

