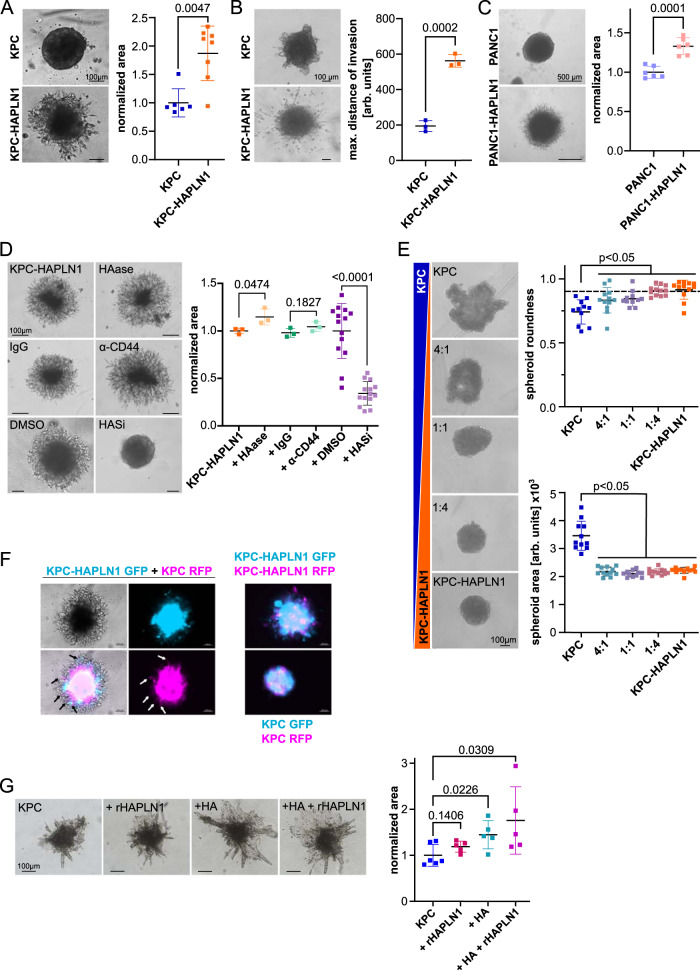
Fig. 3. HAPLN1 fuels invasion and acts in a paracrine manner.
A Invasion of KPC or KPC-HAPLN1 cells 48 h after embedding of the spheroids into Matrigel. The occupied area of spheroids embedded into Matrigel is quantified as a readout of invasion (KPC: n = 6, KPC-HAPLN1: n = 8) and representative images are shown. Scale bar: 100 µm. B Invasion of KPC and KPC-HAPLN1 cells into collagen matrix. Distance of the three most invaded cells to spheroid was measured and averaged per sample. n = 3. Scale bar: 100 µm. C Invasion of PANC1 and PANC1-HAPLN1 cells into Matrigel 48 h after embedding. n = 6. Scale bar: 500 µm. D KPC-HAPLN1 cells embedded into Matrigel. Pictures taken 48 h after stimulation and embedding. Treatment with hyaluronidase (HAase, 200 mg/ml, n = 3), IgG control antibody (1 µg/ml, n = 3), anti-CD44 blocking antibody (1 µg/ml, n = 3), or the HAS inhibitor 4-methylumbelliferrone (HASi, 500 µM) or DMSO (n = 14). Scale bar: 100 µm. E KPC and KPC-HAPLN1 cells were mixed at different ratios. Images are representative of each condition. Scale bar: 100 µm. Spheroid roundness and area are quantified by Fiji software. KPC and 1:1, n = 11; rest, n = 12. F KPC and KPC-HAPLN1 cells were labeled with GFP or RFP via lentiviral vectors. Invasion was assessed after 48 h. Representative images of 3 independent experiments. Scale bar: 100 µm. G Invasion of KPC cells into collagen matrix 96 h after embedding and treating with exogenous HA (10 µg/ml) and/or rHAPLN1 (80 ng/ml). KPC, n = 6; rest, n = 5. Scale bar: 100 µm. Graphs represent mean ± SD. Each data point represents a biological replicate. Unpaired two-tailed T test was used for analysis.

