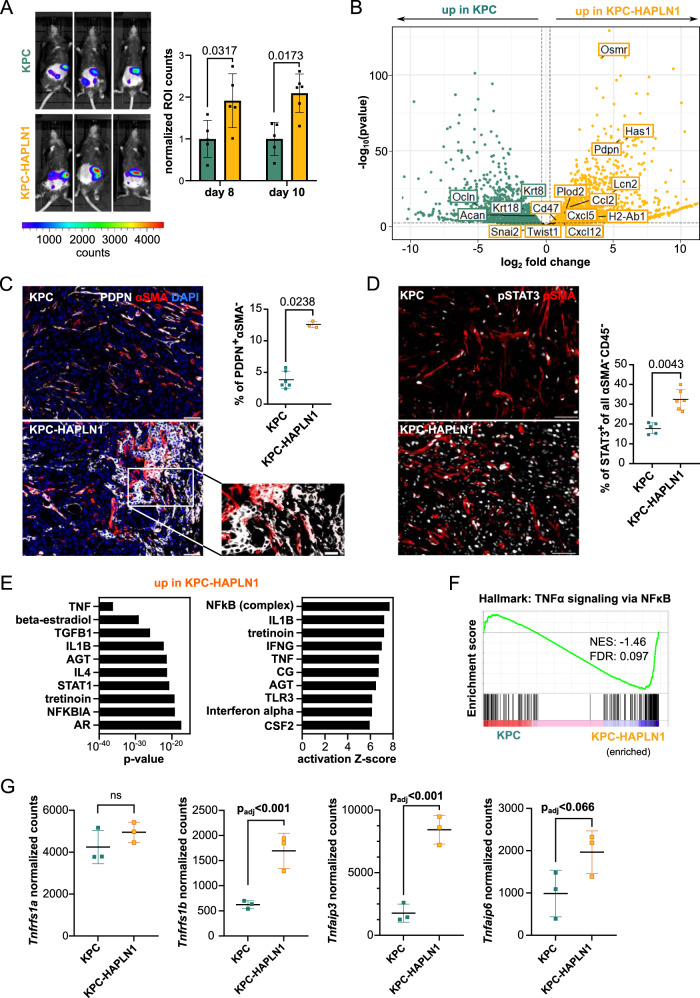
Fig. 4. HAPLN1 induces a highly plastic tumor cell state in vivo.
A In vivo luminescence was measured at day 8 and 10 after tumor cell injection and normalized to the control. Three representative images per group are shown. KPC n = 5; KPC-HAPLN1 n = 6. B Volcano plot obtained from RNA sequencing on tumor cells that were isolated from KPC or KPC-HAPLN1 solid tumors. Each dot represents one gene, with green dots upregulated in KPC and yellow dots upregulated in KPC-HAPLN1 cells. Some genes of interest were labeled. n = 3. C Podoplanin (PDPN)/αSMA staining on tumors. Representative images and quantification of PDPN+ αSMA− cells are shown. Scale bar: 50 µm, zoom: 20 µm. KPC n = 6; KPC-HAPLN1 n = 3. D pSTAT3/αSMA staining on tumors. Representative images and quantification of STAT3+ tumor cells are shown. KPC n = 5; KPC-HAPLN1 n = 6. E Top 10 upstream regulators assessed by ingenuity pathway analysis (IPA) of sorted tumor cells from mouse tumors sorted by p value or activation Z score. F GSEA of “HALLMARK: TNFα signaling via NFκB” on sorted tumor cells. G Normalized read counts of TNFα-related genes in sorted tumor cells from mouse tumors. n = 3. Graphs represent mean ± SD. Data points indicate independent biological replicates. For panels A, C, D non-parametric two-tailed Mann–Whitney U test was used. For panel B, the package DESeq2 in R studio was used. In this package, the Wald test is used for hypothesis testing when comparing two groups. Correction was performed by multiple testing using the Benjamini–Hochberg (BH) method.

