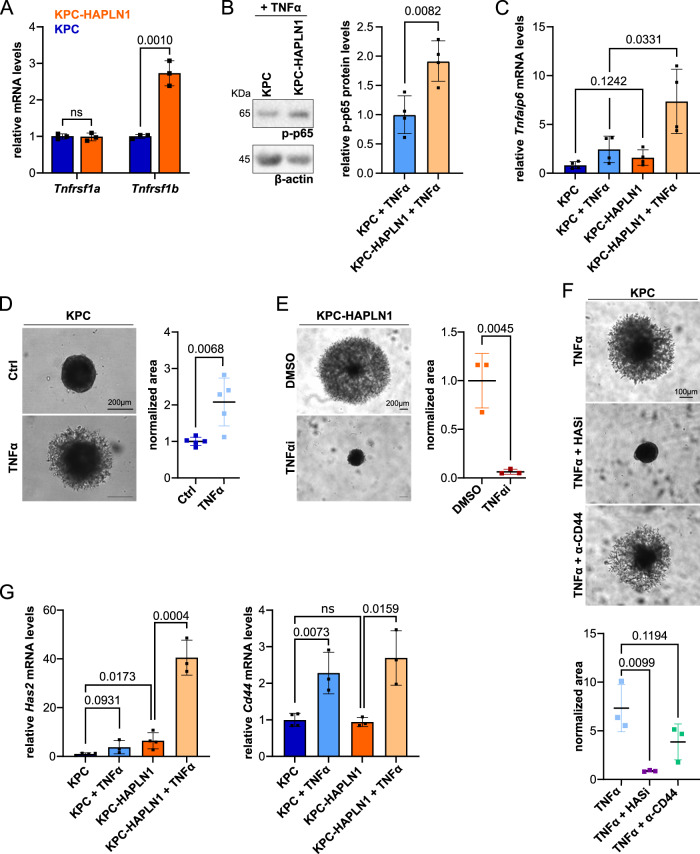
Fig. 5. Increased TNF signaling induces tumor cell plasticity.
A KPC (blue) and KPC-HAPLN1 (orange) cells were cultured and TNFα receptors expression analyzed by qPCR. n = 3. B Western blot analysis of phosphorylated p65 (p-p65) after 15 min of 50 ng/ml TNFα stimulation as readout for increased NFκB signaling. β-actin was used as loading control. n = 4. C Analysis of TNF-induced gene expression in vitro. Stimulation with 50 ng/ml recombinant TNFα for 6 h in starvation. n = 4. D Invasion assay into Matrigel of KPC cells stimulated with 50 ng/ml TNFα. Invasion was measured as relative occupied area 48 h after embedding. n = 5. Scale bar: 200 µm. E Invasion assay of KPC-HAPLN1 cells into Matrigel using an TNFα antagonist (10 µg/ml). n = 3. F Invasion assay of KPC cells into Matrigel after addition of 50 ng/ml TNFα, 500 µM 4-methylumbelliferrone (HASi) or anti-CD44 blocking antibody. Pictures taken 48 h after embedding and stimulation. n = 3. Scale bar: 100 µm. G Relative mRNA levels of Has2 and Cd44 after 6 h of 50 ng/ml TNFα stimulation. KPC n = 4; rest n = 3. Graphs represent mean ± SD. Data points indicate independent biological replicates. Unpaired two-tailed T test was used for statistical analysis.

