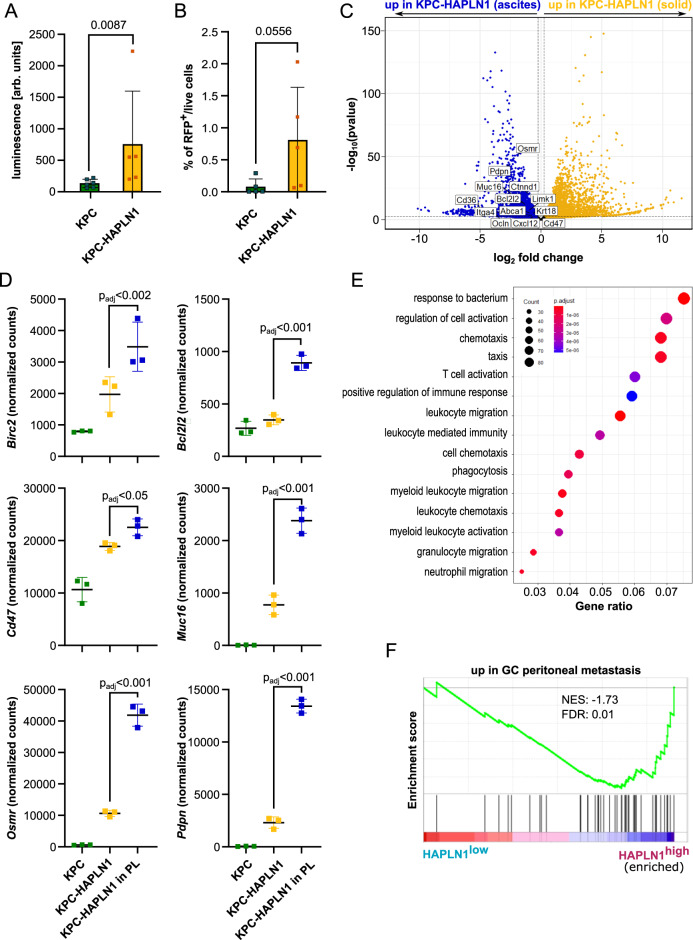
Fig. 7. HAPLN1 facilitates peritoneal colonization by tumor cells.
A Ex vivo luminescence measurement on peritoneal lavage of KPC and KPC-HAPLN1 mice 11 days after tumor injection. KPC n = 6; KPC-HAPLN1 n = 5. B RFP+ tumor cells detected by flow cytometry in the peritoneal lavage of mice at day 11. n = 5. C RNA sequencing results comparing KPC-HAPLN1 cells from solid tumor or in suspension in peritoneal lavage. Blue dots mark genes upregulated in cells in suspension, yellow dots genes upregulated in cells in tumor mass. Some genes of interest are highlighted. n = 3. D Selected genes displayed using normalized read counts. n = 3. E Gene Ontology of ‘Biological Process’ on genes upregulated in KPC-HAPLN1 cells which detached into the peritoneal cavity. F GSEA on the PDAC patient data set of Cao et al. (2021), divided in high or low HAPLN1 expression by the mean HAPLN1 expression. A gene set for genes upregulated in gastric cancer (GC) peritoneal metastasis was used. n = 140. Graphs represent mean ± SD. Data points indicate independent biological replicates. Non-parametric two-tailed Mann–Whitney U test was used for panel A and B. For panels C–E, the package DESeq2 in R studio was used. In this package, the Wald test is used for hypothesis testing when comparing two groups. Correction was performed by multiple testing using the Benjamini–Hochberg (BH) method.

