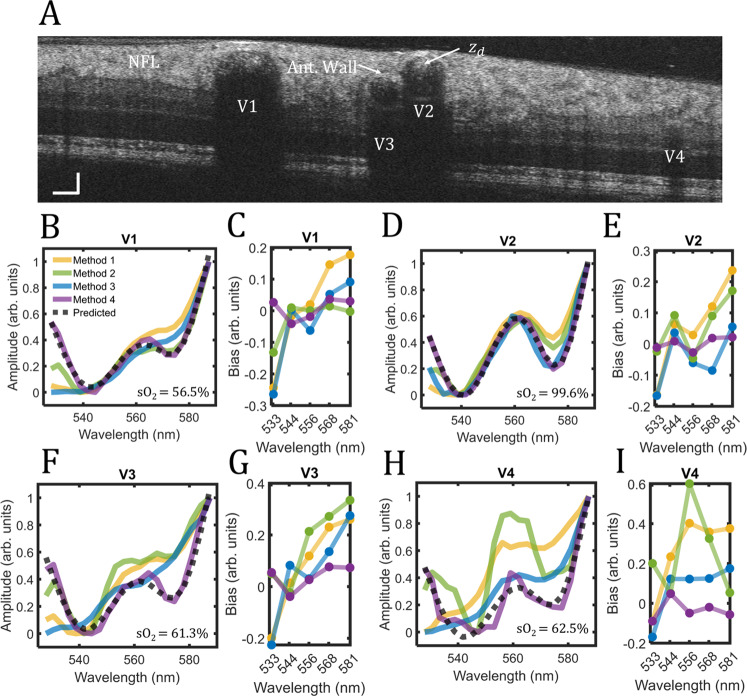
Fig. 3. Comparison of spectroscopic normalization methods.
Spectroscopic normalizations in the human retina. A vis-OCT B-scan of a healthy human retina; vessels labeled V1-V4 were identified as vein, artery, vein, and vein, respectively; B Measured spectra in V1 with no normalization (yellow), normalization by NFL (green), normalization by the anterior vessel wall (blue), and normalization by the start of signal decay in the blood () (purple), respectively; predicted spectrum for sO2 = 56.5% (gray dashed line); C Bias for each normalization with respect to predicted spectrum at five wavelengths; D, E Same analysis for V2 and sO2 = 99.6%; F, G Same analysis for V3 and sO2 = 61.3%; H, I Same analysis for V4 and sO2 = 62.5%.

