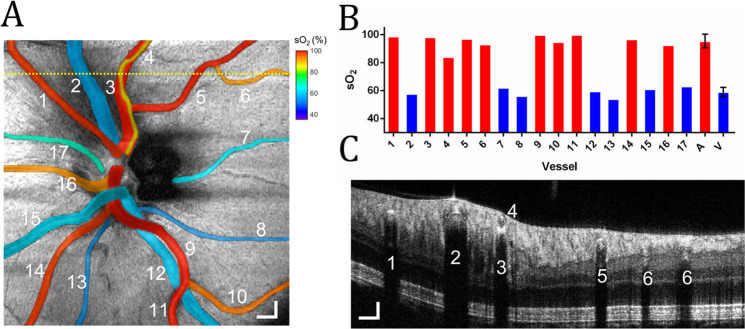
Fig. 4. Oximetry map of the optic disk.
A sO2 measurements in 17 vessels in the optic disk from a healthy 23-year-old. The sO2 values pseudo-colored and overlaid onto the fundus image. Scale bar: 300 μm; B Bar chart plots sO2 measurements from panel A in individual arteries (red bar) and veins (blue) numbered from 1 to 17, as well as average sO2 in all arteries and all veins; C B-scan from the position highlighted by the yellow dashed line in (A.) Scale bars: 150 μm.

