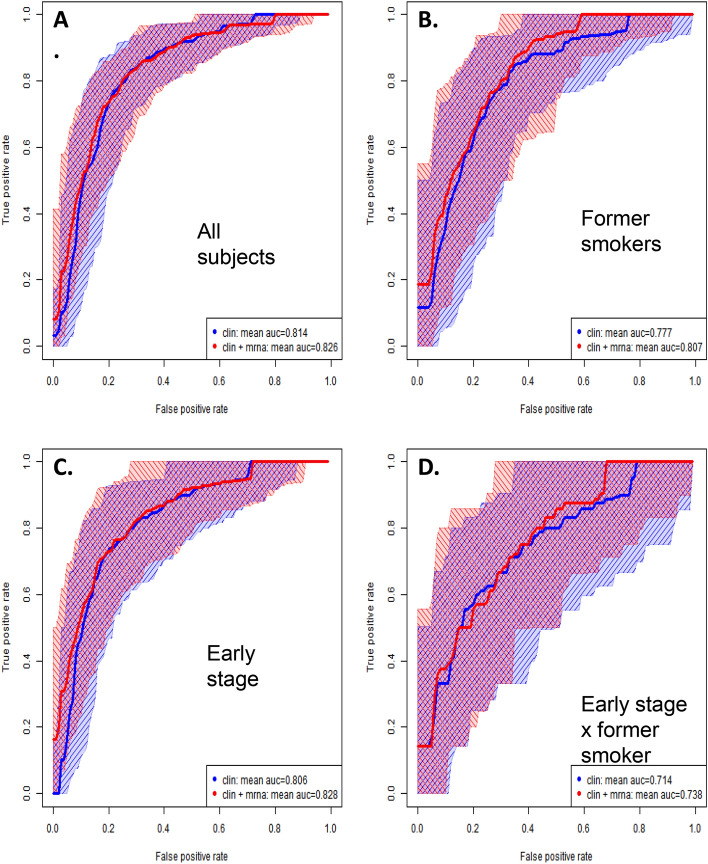
Figure 3.
Receiver Operating Curves (ROC). Compare clinical factors alone model versus clinical factors + exhaled microRNAs combined model (red), to distinguish early stage (I + II) lung cancer all tumor histologies case donors combined, versus non-cancer controls. (A) All smoking categories combined; (B), Former smokers only; (C) Early stage only; (D) Early stage x former smokers. Random forests, recursive partitioning and cross-validation were employed as described in the statistical analysis section. This ROC plot of true positives versus false positives shows borderline incremental information (Fig. 3A, Clinical AUC + 1.2% (p = 0.07)) value of the exhaled microRNAs over and above the clinical model alone, in all subjects combining all smoking status’, stages, and histologies. It particularly held true in main subgroup analyses, separating out former smokers (Fig. 3B, Clinical AUC + 3.0% (p = 6.0e−03)), and in early stage (I,II) models (Fig. 3C, Clinical AUC + 2.2% (5.1e−03)). In combining these subgroups (D), early stage x former smokers combined did not show significant case–control discrimination (Fig. 3D, NS). Model components and significance testing of area under curve (AUC) differences are described in Table 4.

