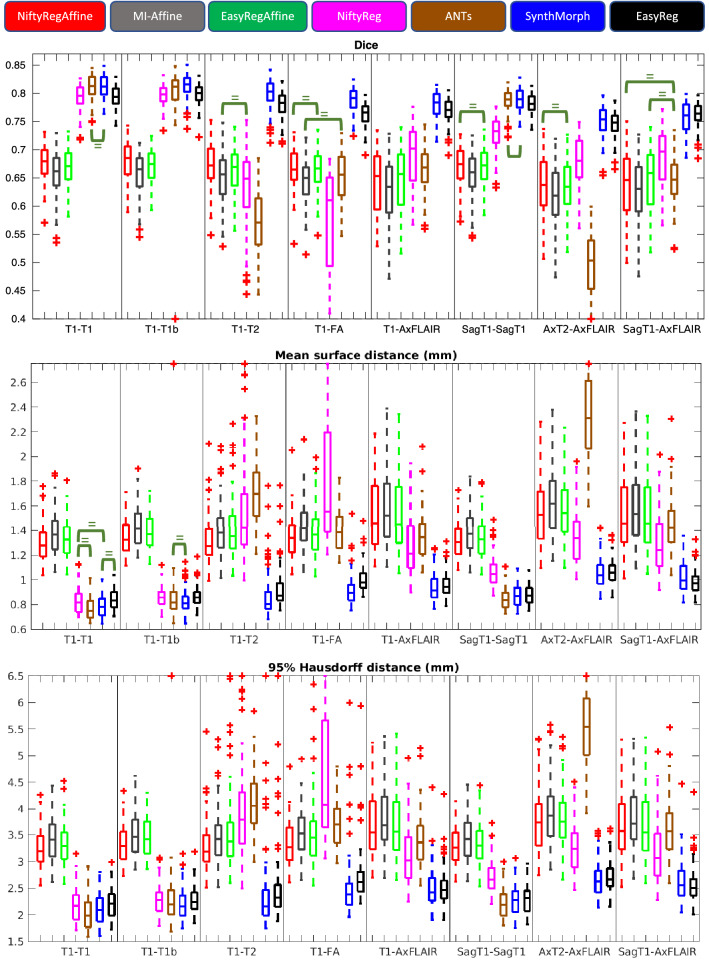
Figure 3.
Box plot for the registration accuracy metrics achieved by the different methods in the different registrations tasks: Dice scores (top), mean surface-to-surface distances (center), and 95% Hausdorff distance (bottom). On each box, the central mark is the median, the edges of the box are the 25th and 75th percentiles, and the whiskers extend to the most extreme datapoints that are not outliers (which are plotted as crosses). The green brackets indicate lack of statistically significant differences between two methods (), according to a non-parametric Wilcoxon test; note that we mark the lack (rather than existence) of differences not to clutter the figures, since most differences are significant (due to the large sample size and to the fact that the values have little noise, as they are averages over brain structures).

