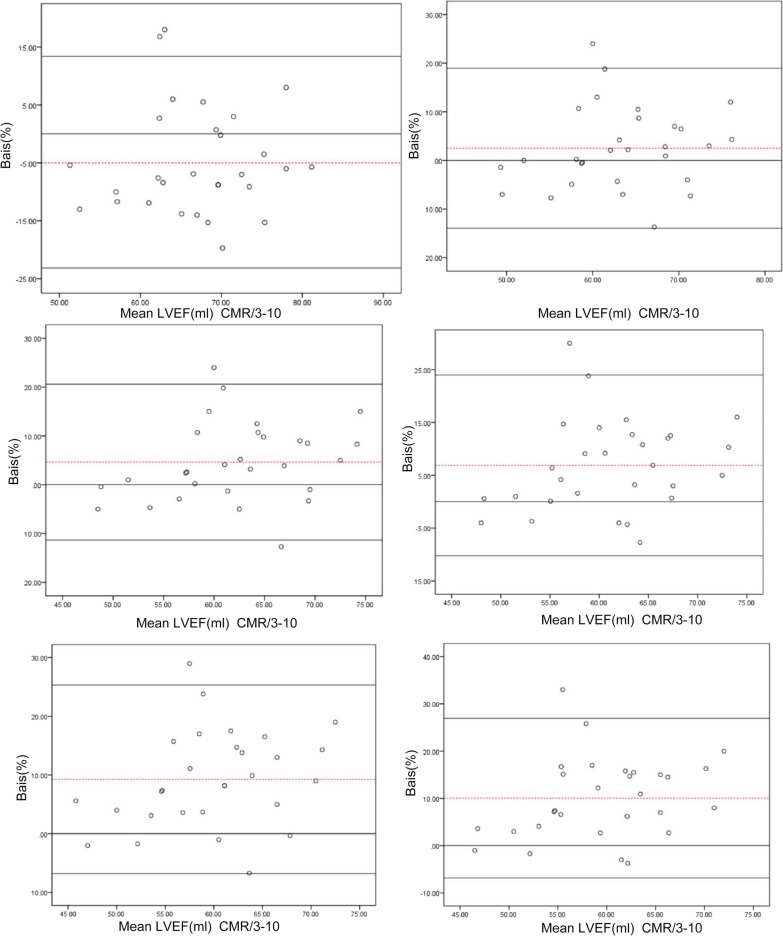
Fig. 5.
Bland‒Altman test for consistency of the left ventricular ejection fraction measured by SPECT with different reconstruction parameters and by cardiovascular magnetic resonance (CMR) in the small-heart group. The dashed line represents the mean of the difference (Xd), and the three solid lines are the upper limit of agreement (LOA) of the difference (Xd + 1.96SD), zero, and the lower LOA of the difference (Xd − 1.96SD) from top to bottom, respectively. Xd mean of the difference; SD standard deviation of the difference

