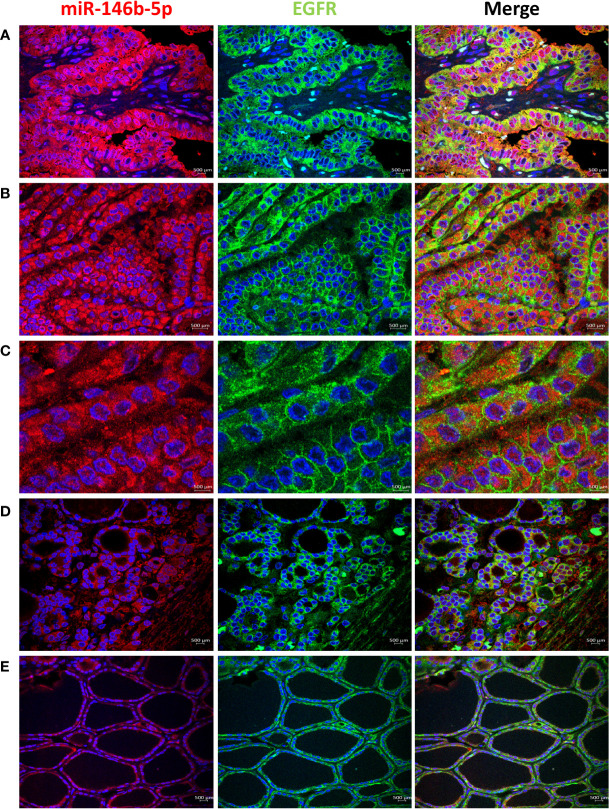
Figure 1.
Expression of EGFR (green) and miR146b-5p (red) in representative samples. (A) PTC showing strong EGFR expression that colocalizes with miR-146 in the cytoplasm of tumor cells. (B) EGFR expression is enriched in the cell membrane in parts of the tissues in PTC. (C) In PTC cytoplasmic and membranous EGFR expression coexist in the same field and is not related to difference in miR-146b-5p level of expression. (D) NIFTP sample showing low cytoplasmic/membranous EGFR expression along with low miR-146b-5p expression in tumor cells. (E) FND sample showing low membranous EGFR expression and low miR-146b-5p in the follicular cells.

