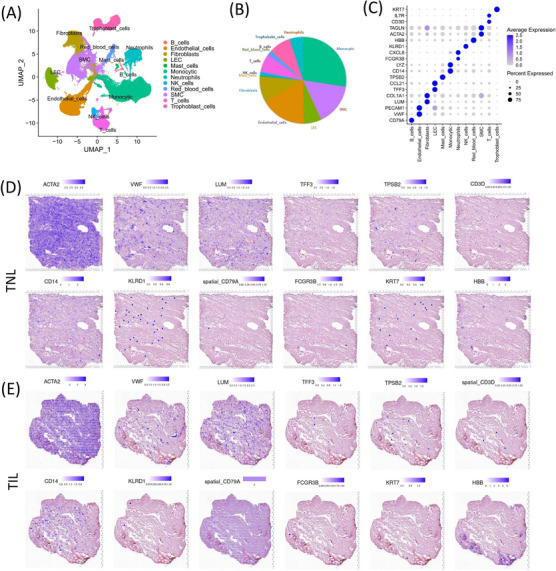
FIGURE 2.

Overall landscapes of the single‐cell RNA‐sequence (scRNA‐seq) and spatial transcriptomics (ST) in the myometrium of the term in non‐labour (TNL) and term in labour (TIL) groups. (A) scRNA‐seq analysis displays the UMAP map of the major myometrial cell populations from TNL (n = 5) and TIL (n = 5) groups. (B) Proportion of each cell population in scRNA‐seq data. (C) Dot plot of the expression of canonical markers for each cell population in scRNA‐seq data. (D, E) Spatial distribution of canonical markers for each cell population were displayed using ST data of the myometrium of TNL (n = 1) and TIL (n = 1) groups.
