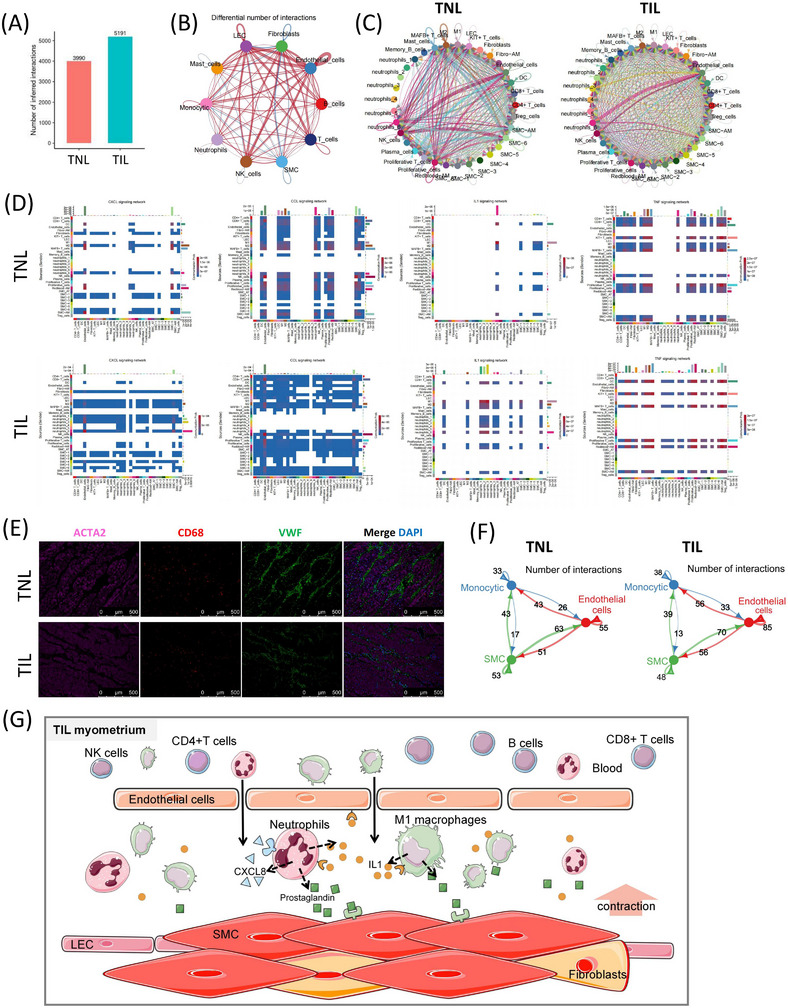
FIGURE 8.

Inflammatory communication in the myometrium of the term in non‐labour (TNL) and term in labour (TIL) groups (A) The total interactions number in the TNL and TIL groups using scRNA‐seq. (B) A differential number of interactions (all ligand‐receptor in CellChatDB database) of major cell populations in the myometrium of TNL and TIL groups. The degree of thickness indicates the interaction number between the sender and the receiver. The red line indicates an increase in the TIL group, and the blue line indicates a decrease in the TIL group. (C) The number of inflammatory interactions (inflammatory ligand‐receptor in CellChatDB database) of cell subpopulations of TNL and TIL groups. The degree of thickness indicates the interaction number between the sender and the receiver. (D) Heatmap of the aggregated cell‐cell communication of representative inflammatory interactions among cell subpopulations in the myometrium of TNL and TIL groups. The colour represents the calculated communication probability. (E) Immunofluorescence indicates the location of three major cell populations in the myometrium of TNL and TIL groups, SMC (ACTA), macrophage (CD68), and endothelial cells (VWF). (F) The number of interactions (all ligand‐receptor in the CellChatDB database) among the three major cell populations in populations myometrium of TNL and TIL groups. (G) The abstract of potential cross‐talks focusing on immune response and SMC contraction in myometrium during labour.
