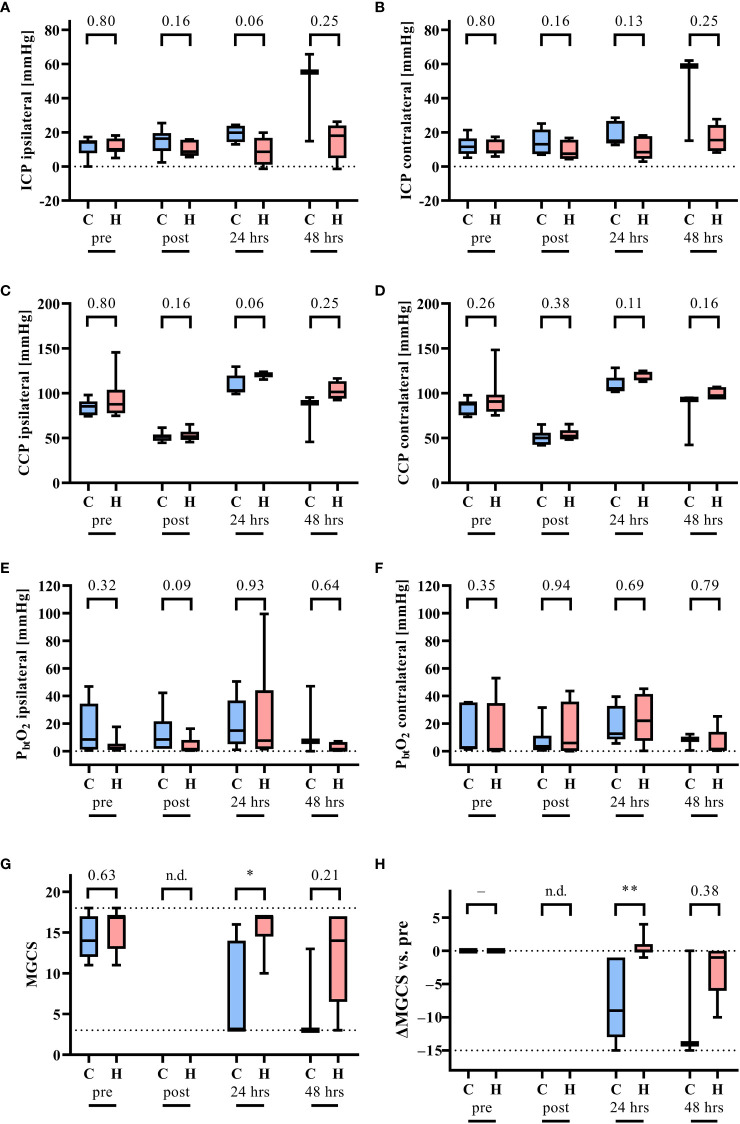
Figure 4.
Monitoring of intracranial pressure (ICP), the cerebral perfusion pressure (CCP) and the partial pressure of O2 in brain tissue (PbtO2) at the site of ASDH (ipsilateral) and the opposing hemisphere (contralateral). Measurements were recorded before (pre) and after 2 hrs of hemorrhagic shock and acute subdural hematoma (post) as well as 24 hrs and 48 hrs after resuscitation n = 7/7 before shock, 7/7 after shock, 5/6 at 24 hrs, and 3/5 at 48 hrs per group for normoxemia (blue, control group, C) and targeted hyperoxemia (red, H), respectively. (A) ICP ipsilateral, (B) ICP contralateral, (C) CCP ipsilateral, (D) CCP contralateral, (E) PbtO2 ipsilateral, (F) PbtO2 contralateral, (G) modified Glasgow Coma Scale (MGCS), and (H) the difference of the MGCS in comparison to before shock. The dotted lines indicate the minimal and maximal possible values as for MGCS. Mann-Whitney U test. * = p < 0.05, ** = p < 0.01. n.d. = not determined. The box plots report the median, interquartile range, minimum, and maximum.

