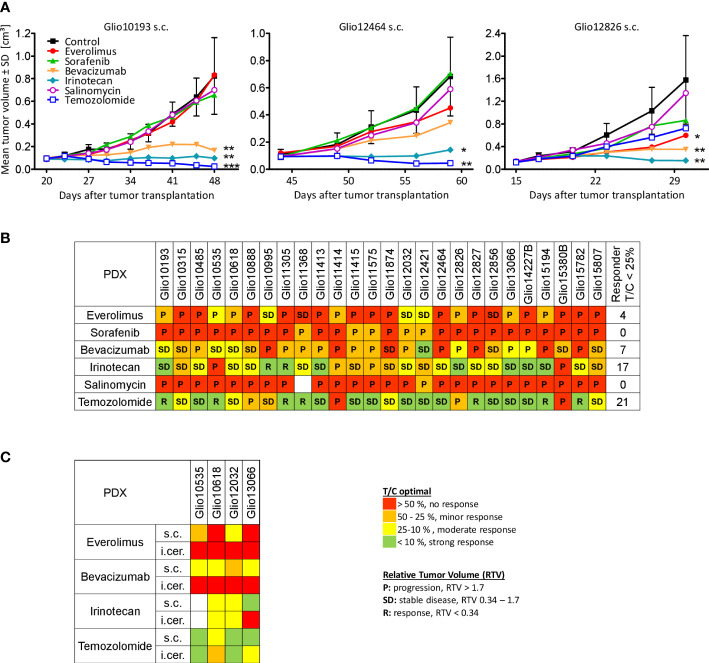
Figure 2.
Chemosensitivity of established glioma PDX. (A) Examples of drug testings of three s.c. glioma PDX models, illustrating model-specific growth characteristics and treatment responses to different drugs, like temozolomide. N=3-5. Mean and standard deviation (SD). One-way ANOVA, Dunnett’s multiple comparison test. Significant differences to control (PBS) at study end: * p < 0.05, ** p < 0.01, *** p < 0.001. (B) Treatment response evaluation as mean tumor volume of treated tumors divided by mean tumor volume of tumors in the corresponding control group (T/C optimal in %) revealed PDX individual sensitivity profiles. In addition, RTV as response criteria is indicated as progression, stable disease or regression in respective groups. N=2-6 per group. (C) T/C values at study end of orthotopic PDX models Glio10535, Glio10618, Glio12032 and Glio13066 revealed reduced sensitivities when compared to matching s.c. models. The maximum tumor area in coronal plane was used as measure for i.cer. tumor growth. RTV could not be calculated for orthotopic PDX, as tumor sizes were only measured once at study end.

