Figure 4.
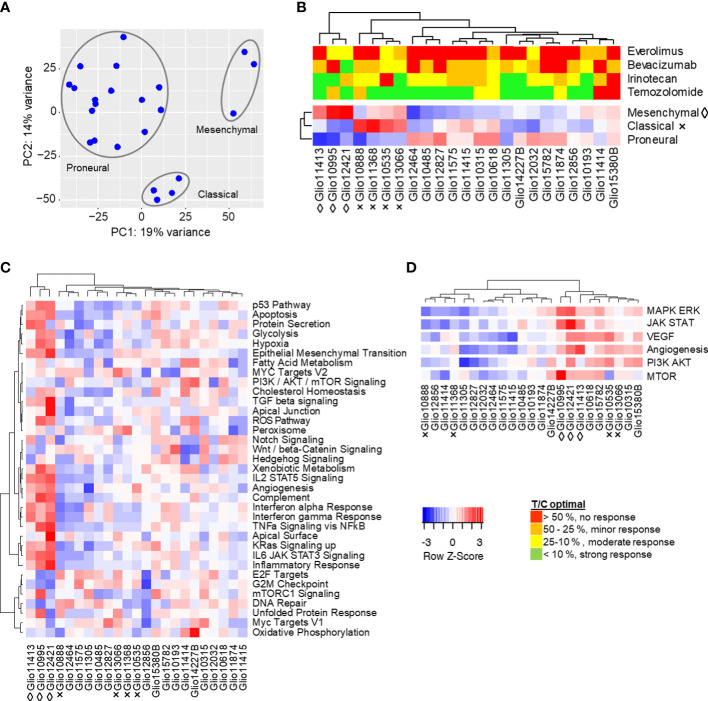
Molecular characteristics of s.c. glioma PDX models. (A) Global gene expression of 23 glioma PDX models by principal component analysis. Similarity of transcriptomes is represented by their spacial distribution in the plot, with three custers visible. (B) The observed clustering into three groups could be replicated in subsequent analyses of expressions of gene sets characteristic for proposed molecular subtypes mesenchymal (◊), classical (×) and proneural (no indication). (C) Single sample gene set enrichment analysis of glioma PDX models regarding 34 selected hallmarks and clustering of models resembling the mesenchymal subtype. (D) Combined enrichment scores of gene sets related to MAPK/Erk, JAK/STAT, VEGF, PI3K/Akt and mTOR signaling, as well as angiogenesis. Gene sets analyzed individually in Figure S3 . Red (positive Z-score): higher expression of gene set than in the average of all models. Blue (negative Z-score): lower expression.

