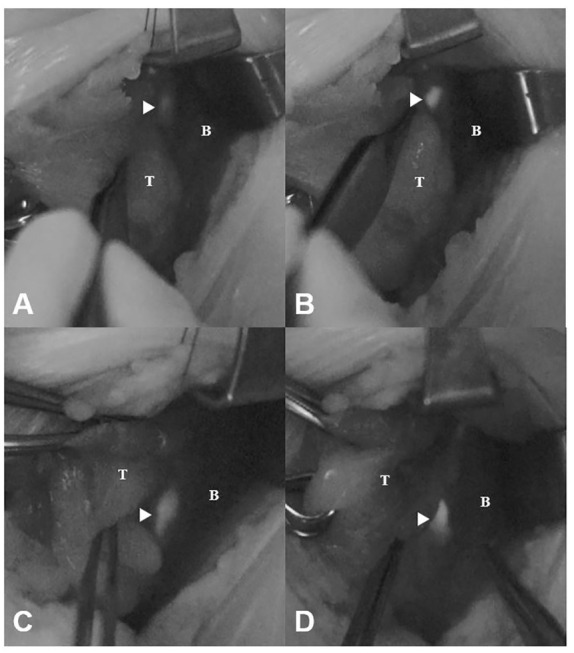
Figure 2.

Faint and bright NIRAF images of unexposed and exposed PGs (arrowheads). (A) Faint image before dissection (NIRAF intensity: 2.15 au). (B) Faint image after dissection (NIRAF intensity: 4.01 au). (C) Bright image before dissection (NIRAF intensity: 3.33 au). (D) Bright image after dissection (NIRAF intensity: 4.77 au). T, thyroid; B, background; NIRAF, near-infrared autofluorescence.
