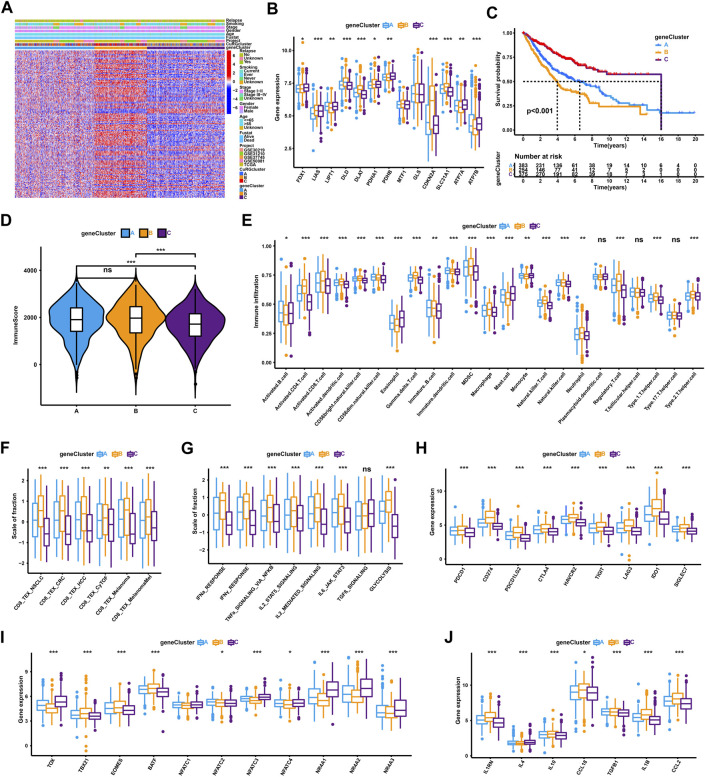
FIGURE 3.
TEX and TIME characterization of the three geneClusters in LUAD. (A) Unsupervised clustering for 150 prognostic-related DEGs identified by univariate Cox regression classifying patients of training cohort into geneClusters A-C, respectively. The geneClusters, CuRGclusters, projects, tumor stage, survival status, relapse, smoking, gender, and age were used as clinical characteristics. (B) Expression of 13 cuproptosis genes in the three geneClusters. (C) Survival analyses for the three geneClusters based on 1,012 patients. (D) Immune score analyses using the ESTIMATE algorithm in the three geneClusters. (E) The abundance of each TME infiltrating cell in the three geneClusters. (F–J) GSVA enrichment analysis between geneClusters A-C with TEX-related signatures (F), signal pathways (G), checkpoint genes (H), transcription factors (I), or inflammatory factors (J). The line in the box represents the median value, and the asterisk represents the p-value. *p < 0.05; **p < 0.01; ***p < 0.001.

