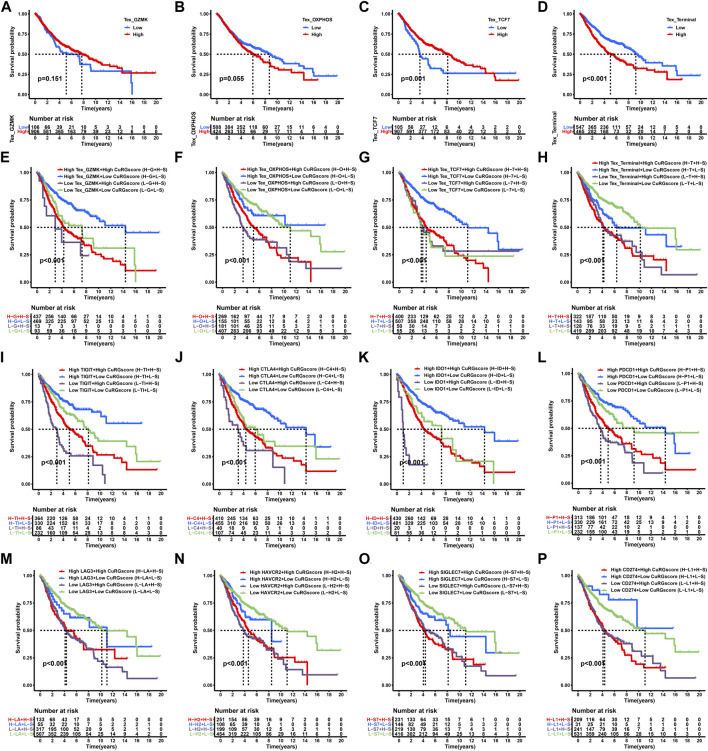
FIGURE 6.
Survival analyses for subgroups of patients stratified by CuRGscores and immune checkpoint genes in the training cohort. (A–D) Survival analysis to examine the OS of patients with LUAD in four TEX subtypes, including GZMK+ (A), OXPHOS- (B), TCF7+ (C), and terminal TEX phenotypes (D). (E–H) Prognosis analysis for patients with LUAD patients stratified into four groups by CuRGscore and four TEX subtypes, including GZMK+ (E), OXPHOS- (F), TCF7+ (G), and terminal TEX phenotypes (H). (I–P) Kaplan-Meier curves analyzed the overall survival of patients with LUAD, stratified into four groups by CuRGscores and checkpoint genes, such as TIGIT (I), CTLA4 (J), IDO1 (K), LAG3 (L), PDCD1 (M), HAVCR2 (N), SIGLEC7 (O) and CD274 (P).

