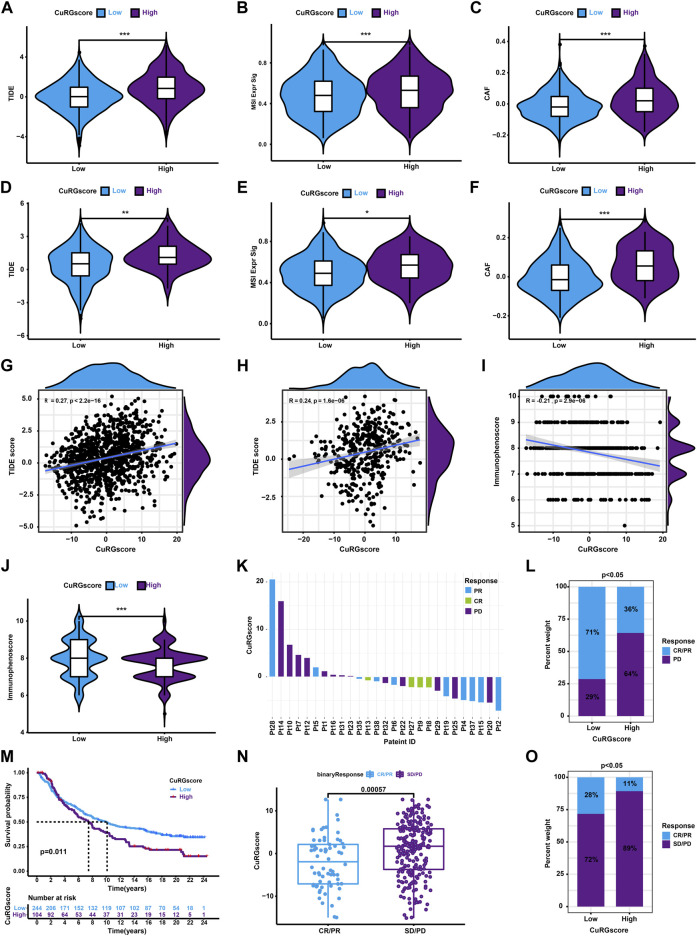
FIGURE 7.
The role of CURGscore in ICB immunotherapy. (A–C) The distribution of TIDE (A), MSI (B), and CAF (C) scores between patients in the high- and low-CuRGscore groups in the training cohort. (D–F) The distribution of TIDE (D), MSI (E), and CAF (F) scores between patients in the high- and low-CuRGscore groups in the testing cohort. (G–I) Spearman correlation analysis for TIDE scores or immunophenoscore with CuRGscore in the training (G), external testing (H), and TGCA-LUAD (I) cohorts. (J) Difference of immunophenoscore between patients in the high- and low-CuRGscore groups in the TGCA-LUAD cohort. (K) Distribution of patients with a distinct anti-PD-1 clinical response based on CuRGscores in the GSE78220 dataset. (L) Distribution of distinct anti-PD-1 clinical response in CuRGscore subgroups in the GSE78220 dataset (chi-square test). (M) Kaplan-Meier plot of overall survival for patients of CuRGscore subgroups in the IMvigor210 cohort (log-rank test). (N) The difference in the CuRGscores in anti-PD-L1 clinical response subgroups in the IMvigor210 cohort (Wilcoxon test). (O) The distribution of distinct anti-PD-L1 clinical response in high- and low-CuRGscore subgroups in the IMvigor210 cohort (chi-square test). PR, Partial Response; PD, Progressive Disease; SD, Stable Disease; and CR, Complete Response.

