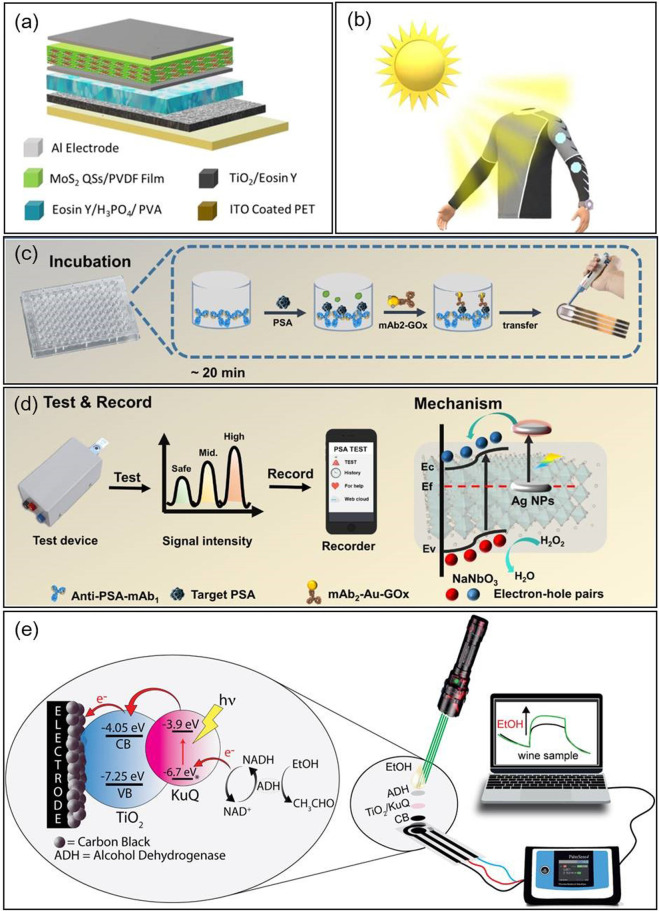
FIGURE 5.
(A) Schematic diagram of the PSCPC device. (B) Conceptional representation of the PSCPC absorbing natural sunlight for powering smart gadgets (Nardekar et al., 2022). (C) Schematic illustration of the incubation process of target PSA in a microtiter plate. (D) Schematic illustration of the PEC recording platform for 3D printed microdevices and the photoelectron transfer of the Ag/NaNbO3 composites. (Xu et al., 2022b). (E) Schematic illustration of the photoelectrochemical sensing system and the experimental set-up for detection of ethanol (Mazzaracchio et al., 2022).

