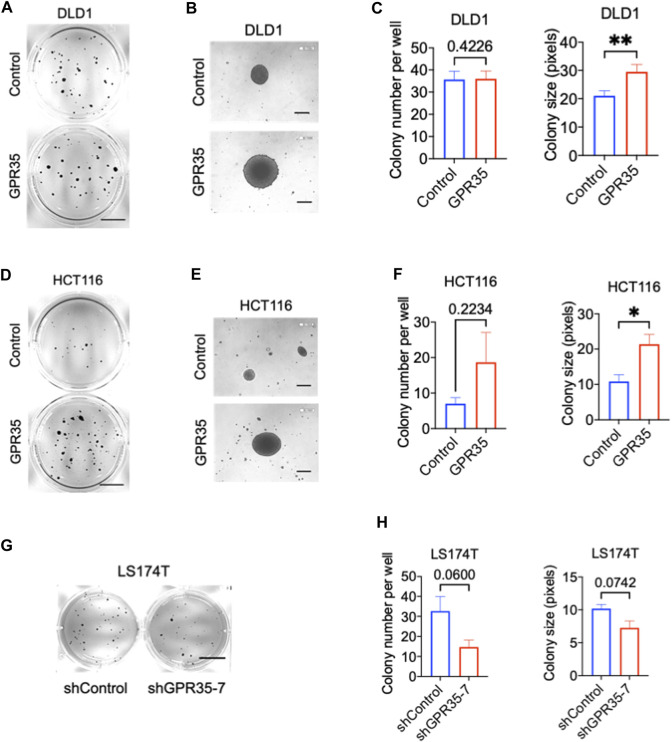
FIGURE 1.
GPR35 promoted anchorage-independent growth in CRC cells. (A–C) Representative images of colonies formed by DLD1 cell lines in soft agar in 21 days and quantification data of soft agar colony formation assay (n = 3). Scale bars: 1.0 cm. (B) Colonies observed with a microscope. Scale bars: 0.1 mm. (D–F) Representative images of colonies formed by HCT116 cell lines in soft agar in 21 days, and quantification data of soft agar colony formation assay (n = 3). Scale bars: 1.0 cm. (E) Colonies observed with a microscope. Scale bars: 0.1 cm. (G,H) Representative images of colonies formed by LS174T cell lines in soft agar in 21 days, and quantification data of soft agar colony formation assay (n = 3). Scale bars: 1.0 cm.

