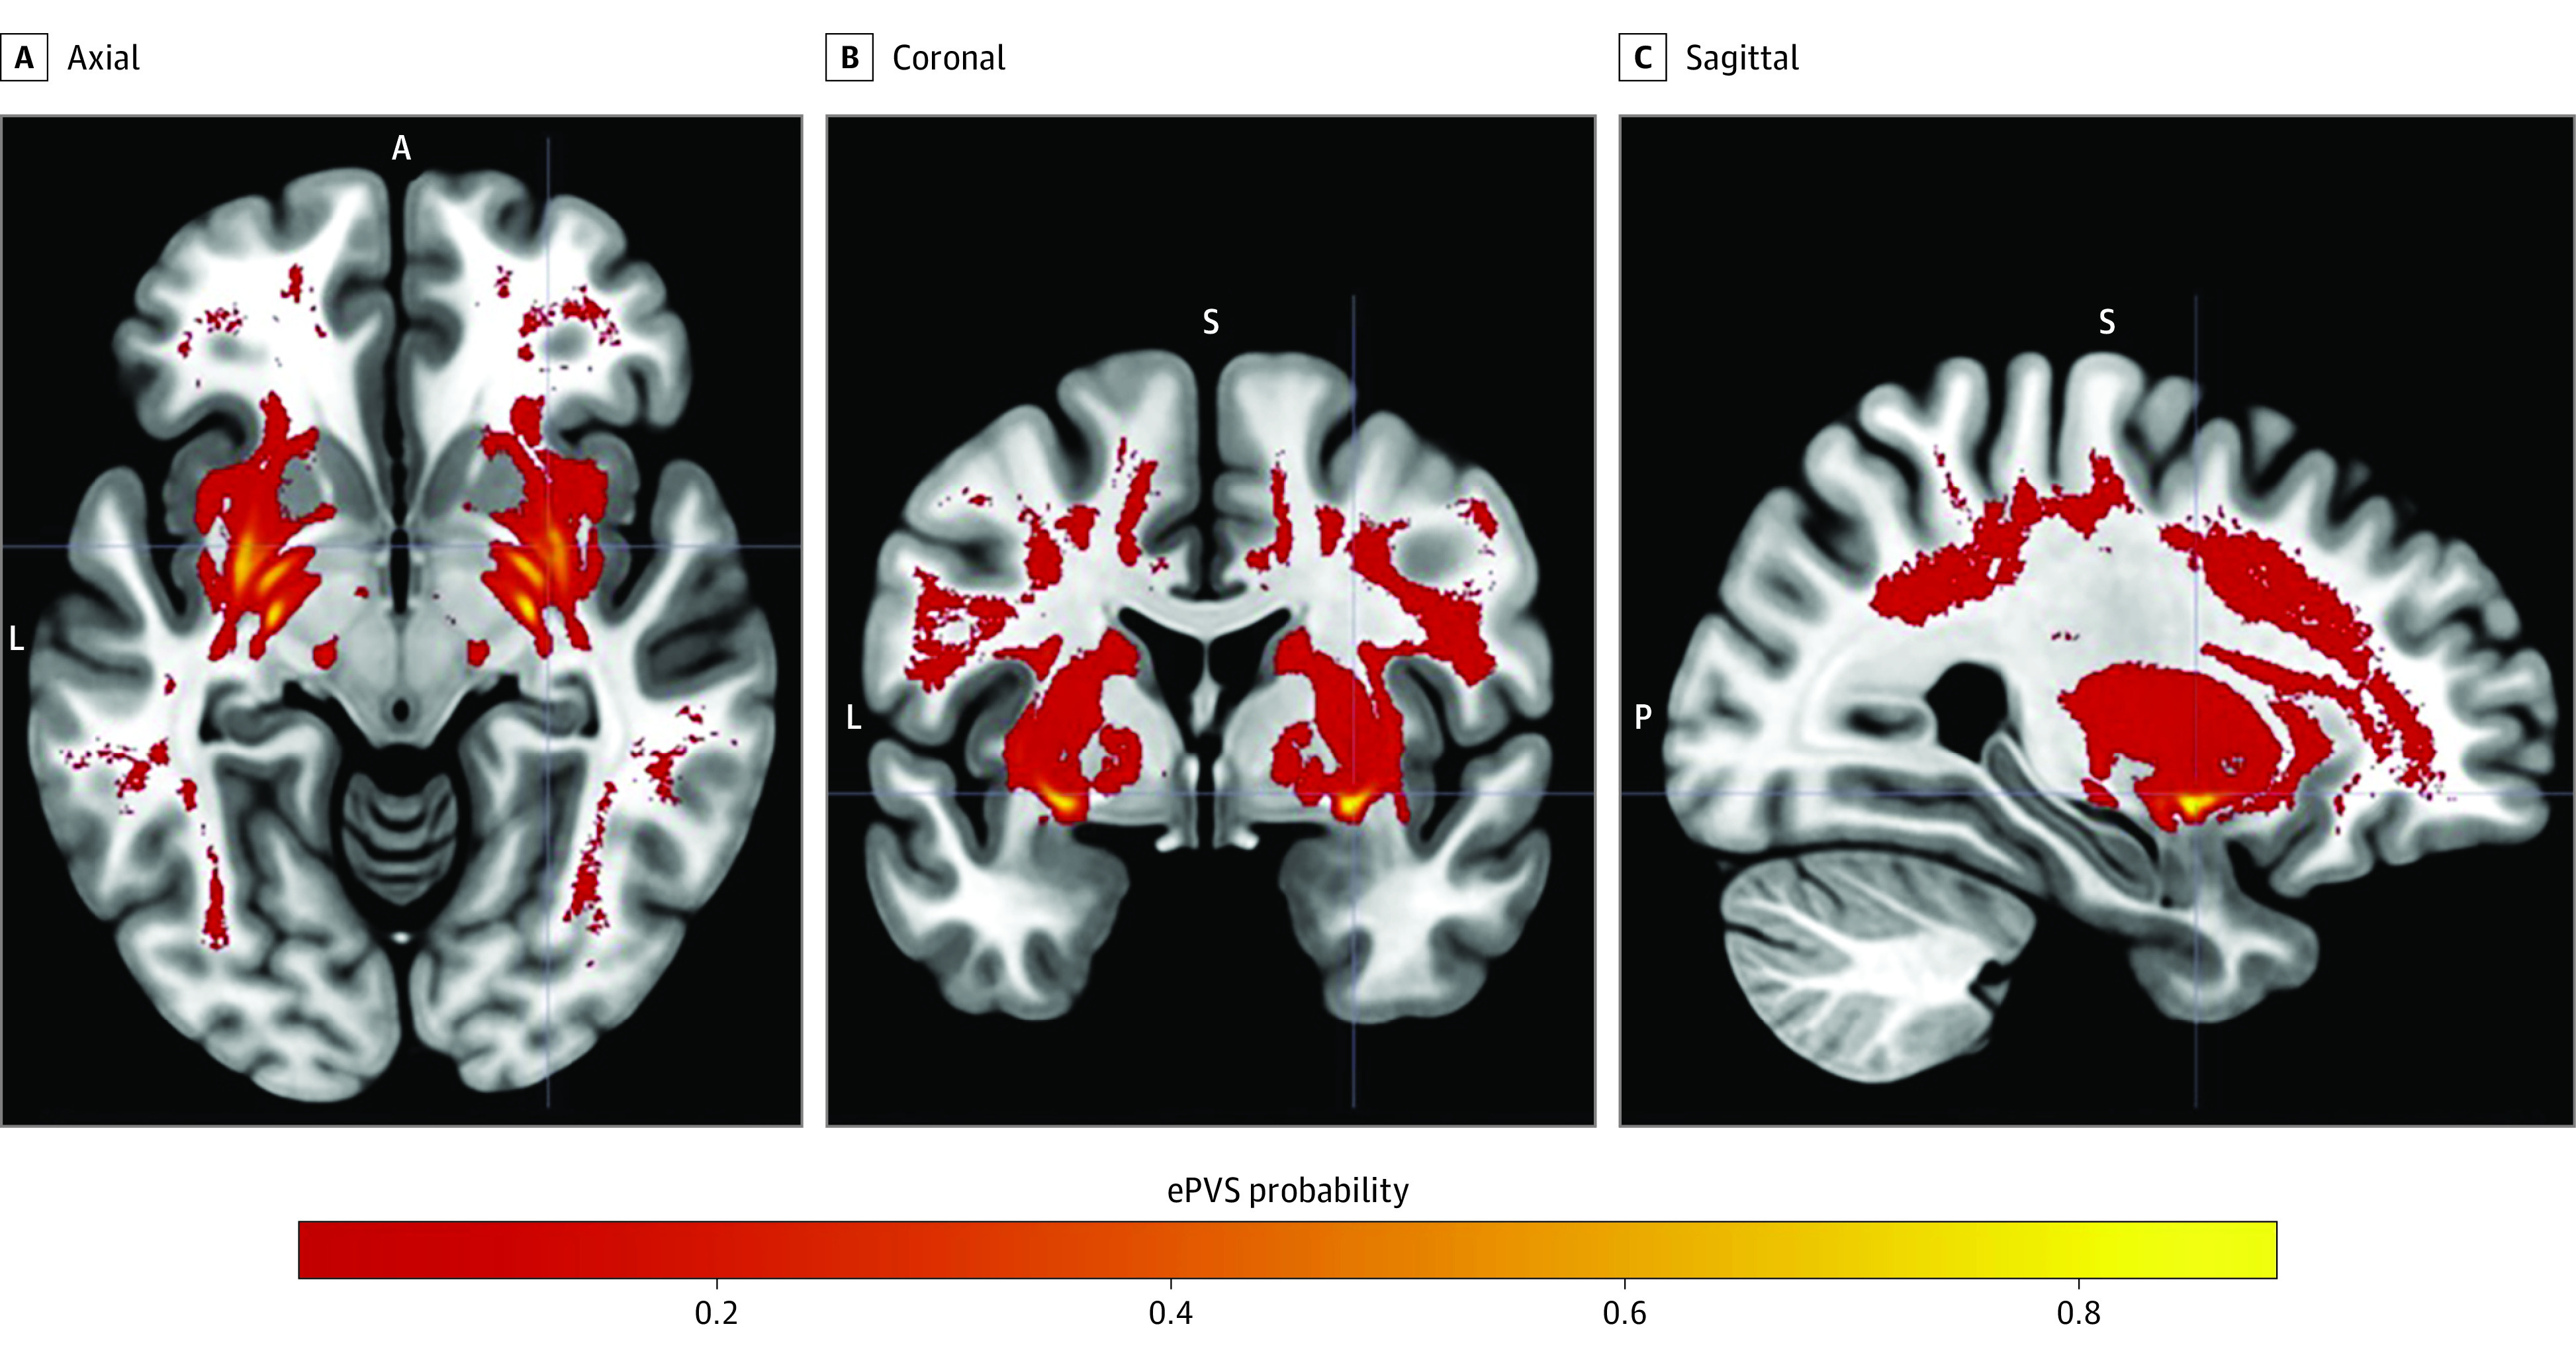
Figure. Frequency Maps Depicting the Distribution of Enlarged Perivascular Spaces (ePVSs).

Values represent the probability of detecting an ePVS at the respective anatomic location. A indicates anterior; FLAIR, fluid-attenuated inversion recovery; L, left; P, posterior; and S, superior.
