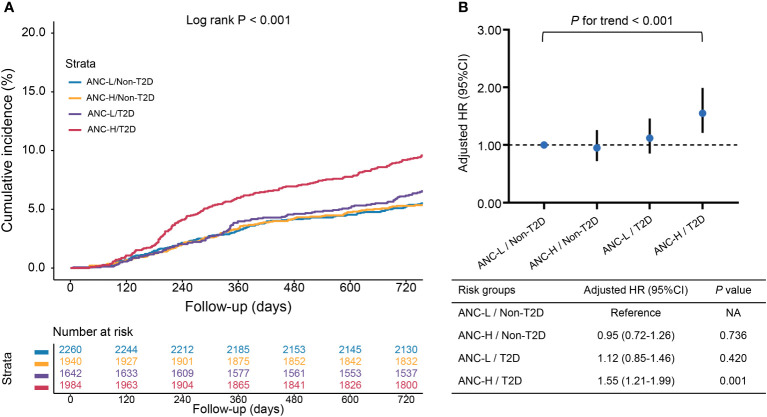
Figure 3.
The associations of risk groups with the risk of MACCEs. (A) Kaplan–Meier curves for cumulative incidence of MACCEs according to four risk groups; (B) Hazard ratios (HRs) [95% confidence intervals (CIs)] for MACCEs according to four risk groups. Model adjusted for age, male sex, BMI, hypertension, dyslipidemia, smoking history, previous MI, previous PCI/CABG, previous stroke, NSTE-ACS, hsCRP, eGFR, LVEF, LM/three-vessel disease, CTO lesions, number of treated vessels, and SYNTAX score. Abbreviations as in Figure 1 .

