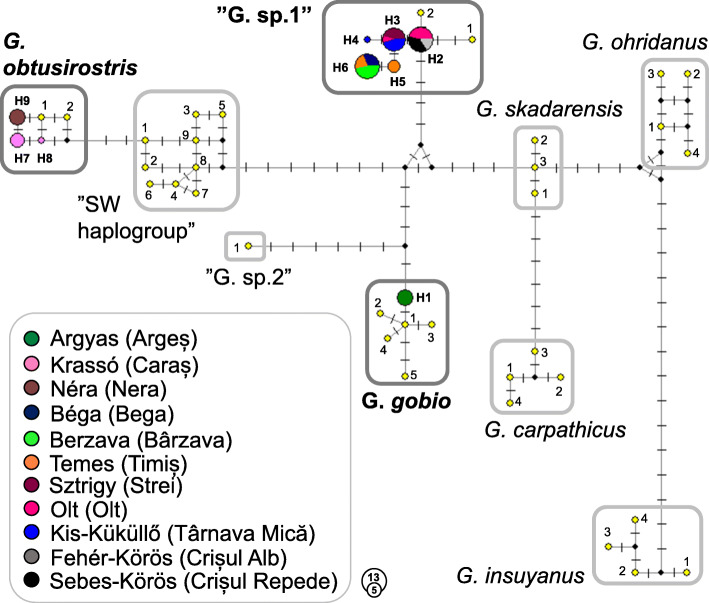
Fig. 3.
Median-Joining network of mtCR sequence data of the investigated 56 Gobio individuals and close relative Gobio haplotypes. Circle size is relative to the number of individuals carrying the same haplotype. Color codes show the origin of the individuals sharing the same hapylotypes. Line length refers to the genetic distances of haplotypes. Each vertical line is one mutation step. Small black circles represent median vectors (missing or theoretical haplotypes). H1–H9: Haplotypes of the 56 specimens analysed in this study. Previously published haplotypes are marked by yellow circles. The numbers in each box correspond with the numbers displayed in Table 2. The names of valid species are italicized; the name of the two groups with an uncertain taxonomic position is enclosed in quotation marks. The haplogroups indicated during this study are highlighted with a dark gray frame and with bold letter type

