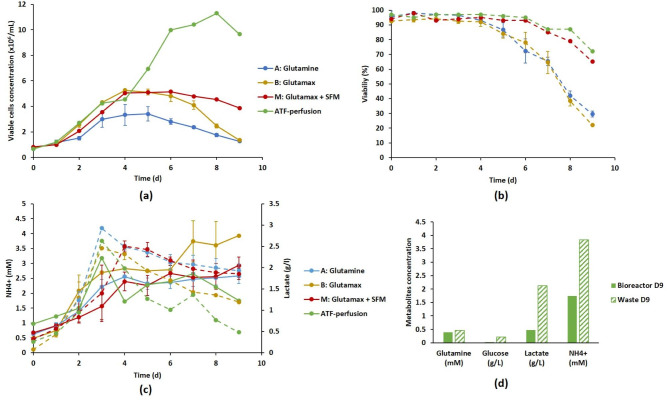
Fig. 7.
Scale-up in a 3 L bioreactor of the DuckCelt®-T17 culture using batch (glutamine and glutamax), fed-batch (glutamax + SFM) or perfusion processes. Time evolution of cell growth (solid line) (a), viability percentage (dotted line) (b) and waste product concentration (ammonium in solid line and lactate in dotted line) (c). Comparison of metabolic profiles at day 9 between the culture permeate and the bioreactor culture medium (d). Results are presented as means ± SD (n = 3 for strategies A and M, n = 2 for strategy B, n = 1 for perfusion assay)

