
Figure 2.
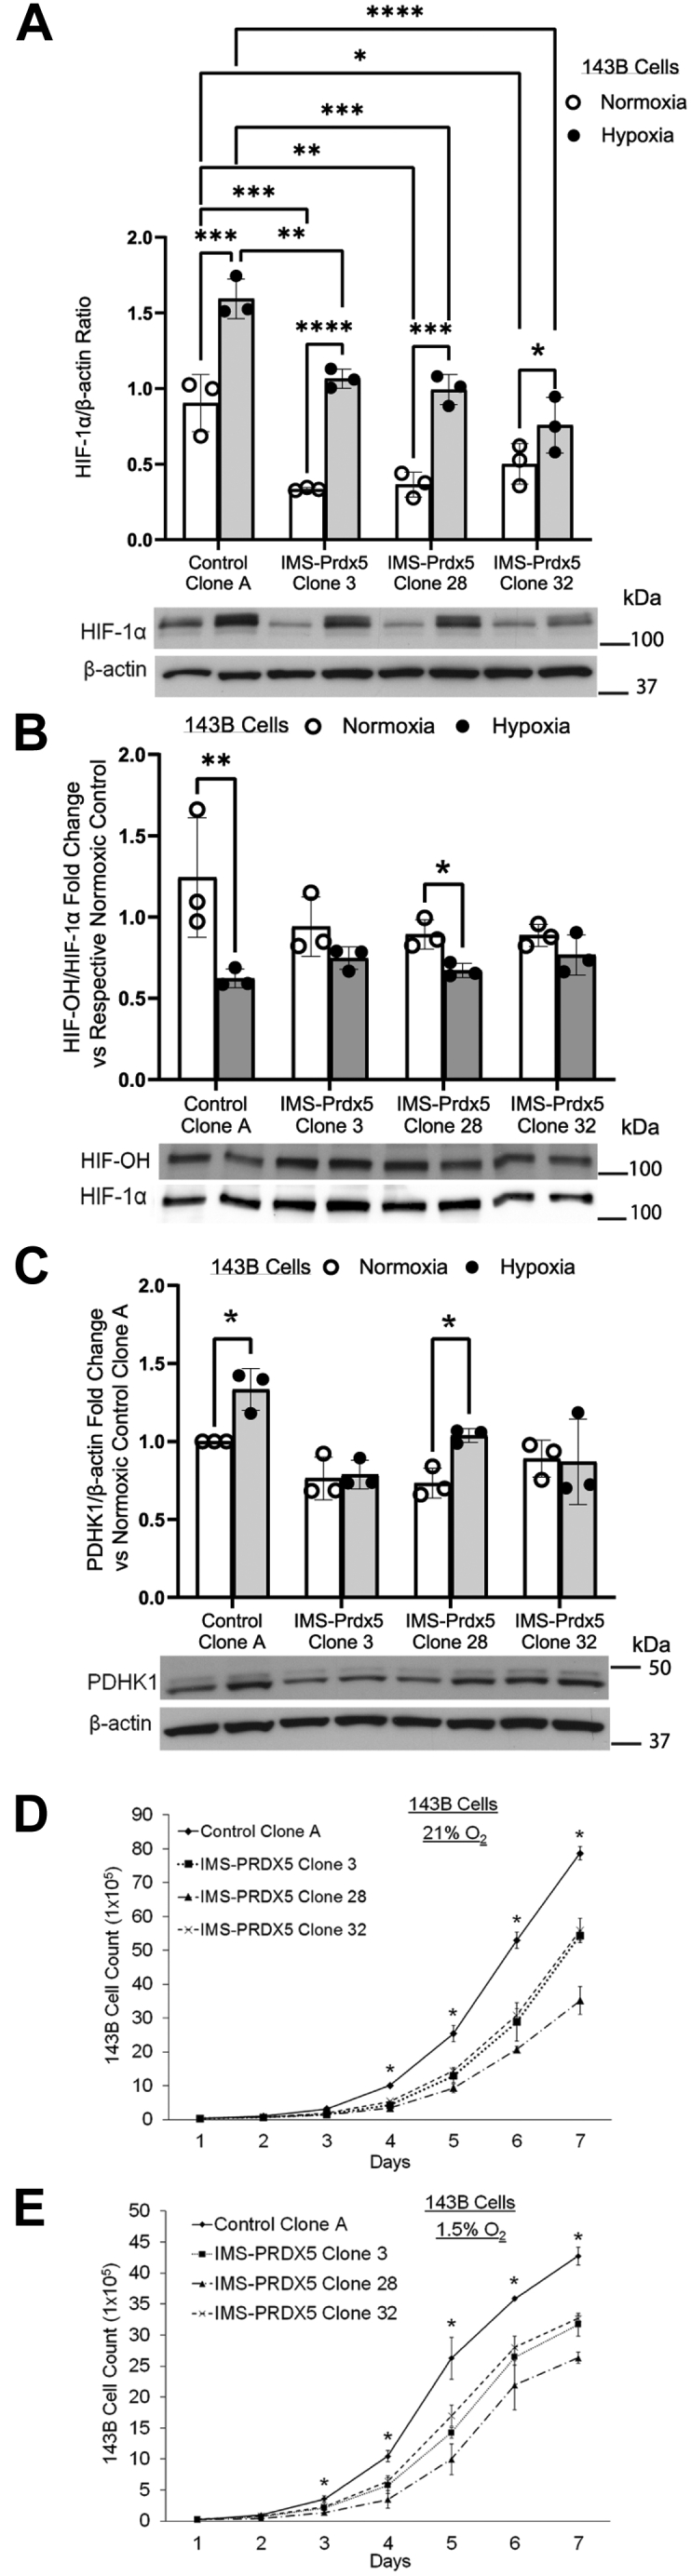
Stable IMS-Prdx5 expression in 143B osteosarcoma cells attenuates normoxic and hypoxic HIF-1α stabilization and activity, as well as the hypoxia-induced decrease in hydroxylated HIF-1α, in a dose-dependent manner.A, cells were exposed to hypoxia for 8 h prior to collecting lysates for detection of HIF-1α by Western blot. ‡p ≤ 0.05 versus normoxic Control Clone A. +p ≤ 0.05 versus hypoxic Control Clone A. ∗p ≤ 0.05 versus respective normoxic value. B, cells were exposed to hypoxia for 4 h in the presence of 10 μM MG132, a proteasome inhibitor, prior to collecting lysates for detection of hydroxylated HIF-1α. Expression levels of HIF-1α-OH relative to total HIF-1α in the same blot are shown. The super shifted bands in the HIF-1α-OH blot represent glycosylated HIF-1α. ∗p ≤ 0.05 versus respective normoxic control. C, cells were exposed to hypoxia for 8 h prior to collecting lysates for PDHK1 detection by Western blot. ∗p ≤ 0.05 versus respective normoxic control. 2 × 10⁴ cells were seeded in parallel in 10 cm dishes and one dish was counted each day for 7 days in (D) 21% O2 or (E) 1.5% O2. ∗ p ≤ 0.05 for Control Clone A versus all IMS-Prdx5 clones. Data shown as mean ± SEM (n = 3 for all groups). HIF, hypoxia-inducible factor, IMS, intermembrane space; PDHK1, pyruvate dehydrogenase kinase-1; Prdx5, peroxiredoxin-5.