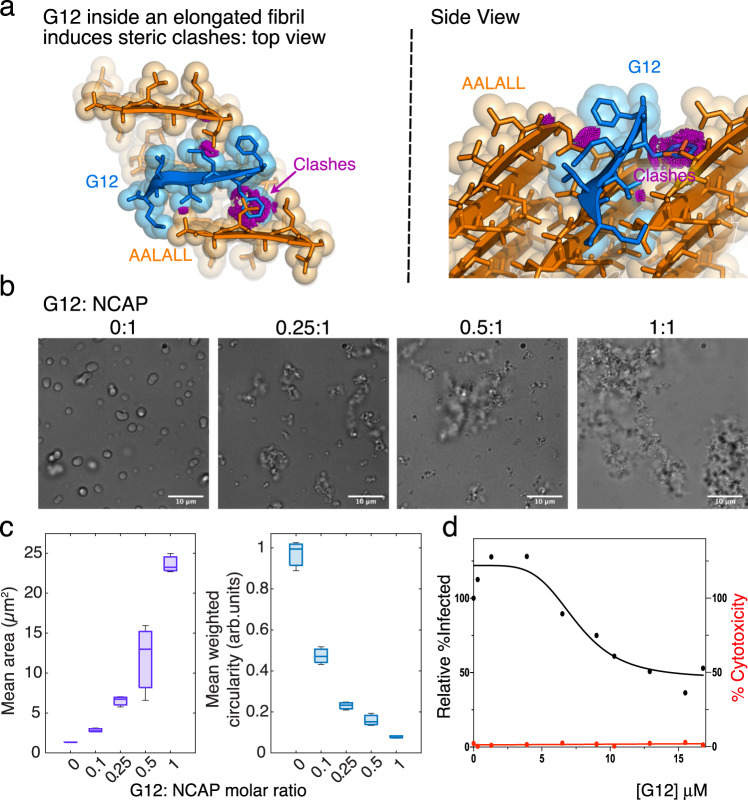
Fig. 5. Design and evaluation of NCAP’s self-assembly disruptor, G12.
a The Rosetta-based design of G12 templated by the AALALL X-ray crystal structure form 1 (Fig. 4; Table 1). Model of the G12 (blue) capping an AALALL fibril (orange). The top view is down the fibril axis and the side view is tilted from the axis. Additional AALALL strands are shown adjacent to the bound G12 to illustrate their steric clashes (magenta). b Differential interference contrast (DIC) images of NCAP + S2hp mixtures incubated in the absence (0:1) and presence of increasing concentrations of G12 revealing the PS disrupting activity of G12. c Mean area (purple) and mean circularity (blue; normalized to particle size) of droplets and particles quantified from a series of light microscopy images of NCAP + S2hp mixtures with increasing concentrations of G12. The experiment was performed in three biological repeats, each with technical triplicates. Five images were collected for every technical replicate. A representative plot is presented. In boxplots the central mark indicates the median, and the bottom and top edges of the box indicate the 25th and 75th percentiles, respectively. The whiskers extend to the most extreme data points (n = 3 replicates). d Dose–response analysis of HEK293-ACE2 cells treated with 10 different concentrations of G12 and fitted with a nonlinear regression model (black line). The 95% confidence interval of the IC50 for G12 was estimated to be between 7 and 11 μM. Cytotoxicity testing of G12 at each concentration (red line) indicates that G12 is non-toxic. Each dot represents the mean value of three technical replicates. Source data for panels c and d are provided as a Source Data file.

