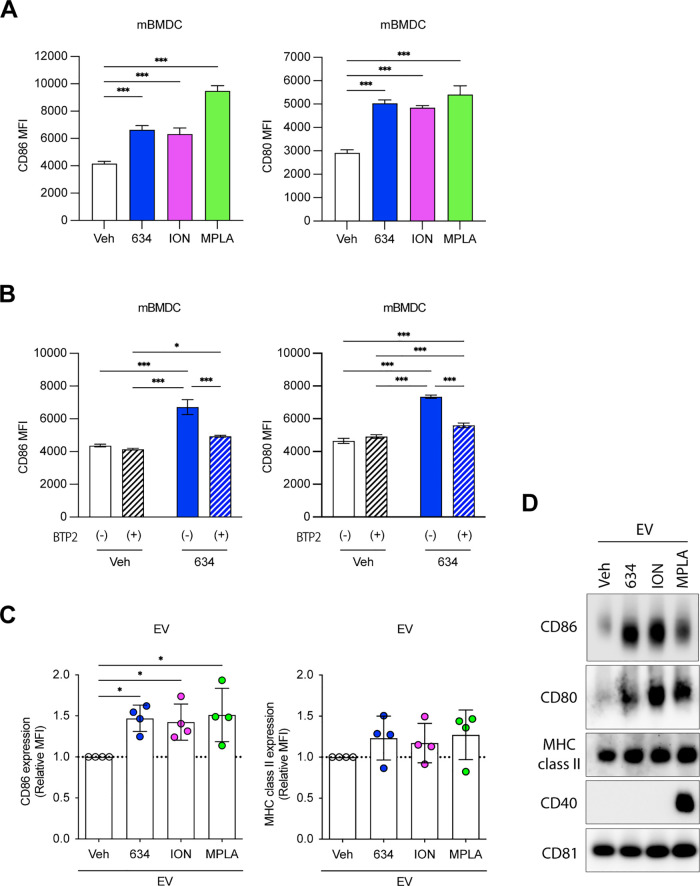
Figure 3.
Compound 634 enhances costimulatory molecule expression on mBMDC and EV634. (A and B) After incubation with 634 (10 μM), ION (1 μM), MPLA (1 μg/mL), Veh (0.5% DMSO), BTP2 (5 μM), or 634 plus BTP2 for 20 h, mBMDCs were stained with a cocktail of anti-CD11c, anti-CD86, anti-CD80, anti-MHC class II, and anti-CD40 and analyzed by flow cytometry. The mean fluorescence intensity (MFI) is shown. Data shown are means ± SDs of triplicates representative of two independent experiments. (A) ***p < 0.001 by one-way ANOVA with Dunnett’s posthoc test vs Veh. (B) *p < 0.05, ***p < 0.001 by two-way ANOVA with Tukey’s posthoc test. (C) EVVeh, EV634, EVION, and EVMPLA were stained with a cocktail of vFRed, anti-CD86, and anti-MHC class II and analyzed by flow cytometry. Relative MFI to EVVeh is shown. CD86: 58.4 ± 0.4 at 1st batch, 49.2 ± 0.2 at 2nd exp., 56.0 ± 0.5 at 3rd exp., and 63.1 ± 3.7 at 4th exp. and MHC class II: 416.5 ± 57.3 at 1st exp., 556.5 ± 44.5 at 2nd exp., 711.5 ± 16.3 at 3rd exp., and 559.0 ± 14.1 at 4th exp. were set as 1, respectively. Each dot represents a data set from individual mBMDC batches. Data shown are means ± SDs of EVs from four different mBMDC batches. *p < 0.05 by one-way ANOVA with Dunnett’s posthoc test vs EVVeh. (D) Immunoblot of EVs. The protein (2 μg/well) was separated and probed with anti-CD86, anti-CD80, anti-MHC class II, anti-CD40, or anti-CD81 antibodies. The images shown are representative of two independent experiments with similar results.

