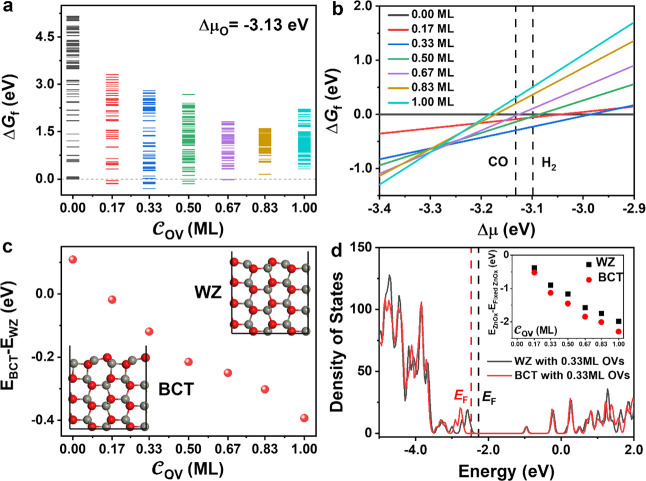
Figure 3.
(a) Thermodynamic convex hull for ZnO(101̅0) with different OV concentrations referring to the perfect ZnO(101̅0) surface under the experimental condition (ΔμO= −3.13 eV). The chemical potential of surface oxygen is referenced to a gaseous O2 molecule. (b) Phase diagram made up of global minima (GM) for ZnO (101̅0) with different OV concentrations at 673 K and a pressure of 2.5 MPa. In the H2-rich zone, the ZnO surface is reduced by H2, while in the CO-rich zone, the ZnO surface is reduced by CO. (c) Energy difference between the BCT surface and WZ surface as a function of OV concentration. The inset shows the side views of the BCT and WZ surfaces, respectively. (d) Density of states (DOS) of the WZ and BCT surfaces with 0.33 ML OVs, and the inset is the computed energy difference between the fixed and relaxed configurations as a function of OV concentration.

