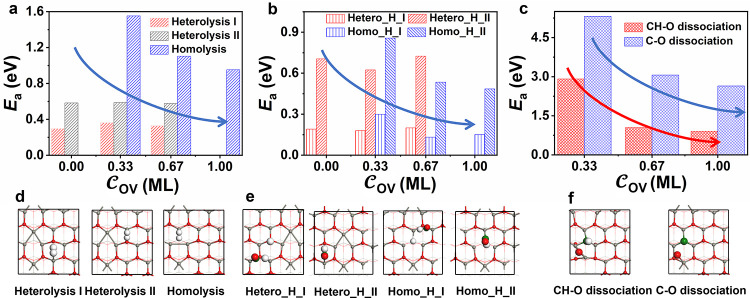
Figure 6.
Comparison of the H2 dissociation barrier (a), CO hydrogenation barrier (b), and C–O dissociation barrier (c) on ZnO(101̅0) with various concentrations of OVs. The corresponding configurations of H2 dissociation (d), CO hydrogenation (e), and C–O dissociation (f) on ZnO(101̅0) with 0.33 ML OVs for illustration purposes. Some reaction pathways do not occur at some OV concentrations and therefore are not shown in the figure.

