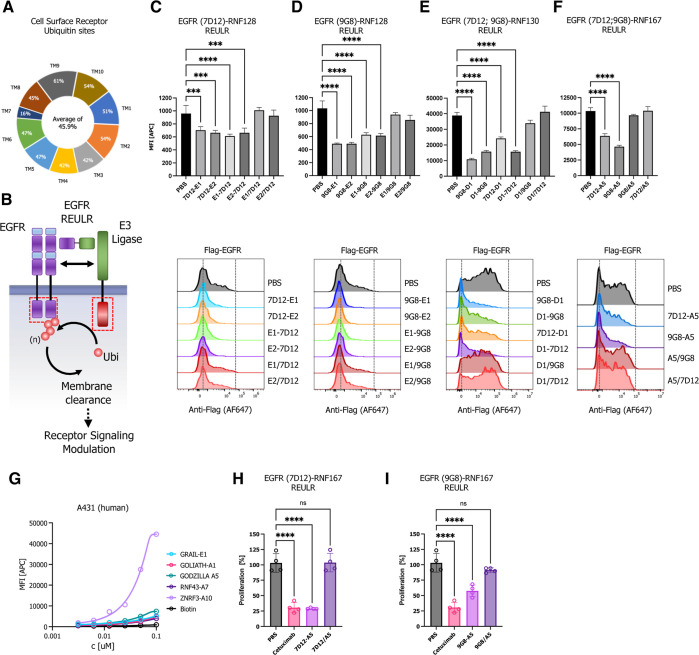
Figure 2.
EGFR REULR. (A) Analysis of MS (Mass Spectrometry)-validated proteome wide ubiquitin sites matched to the human membrane proteome, subclassified by the number of transmembrane domains. (B) Schematic representation of EGFR degradation using a EGFR–REULR molecule. (C–F) HEK293T cells were transiently transfected with FLAG-tagged full-length EGFR cDNA (human) under the control of a constitutively active CMV (cytomegalovirus) promoter. 24 h post-transfection, cells were incubated with EGFR–REULR molecules (50 nM) as indicated using RNF128 (E1; E2)-, RNF130 (D1)-, or RNF167 (A5)-targeting nanobodies in combination with EGFR-binding moieties (7D12; 9G8) in varying orientations as indicated in comparison to monomeric nanobodies or PBS. After 24 h, cells were subjected to FACS analysis using a FLAG antibody (Alexa Fluor 647 conjugate) to monitor EGFR levels on the cell surface. Representative FACS histograms are visualized below the quantified data. Data are mean ± s.d. (n = 3 replicates). (G) Cell surface staining of A431 human squamous carcinoma cell using a panel of five PA-TM-RING E3 ligase-binding nanobodies (nanobody:SA647 tetramers) and analysis by flow cytometry, full titration (1:1 dilutions; 100 nM tetramer), and Biotin:SA647 (Biotin) served as a negative control. (H,I) Cell proliferation assay (CellTiter-Glo 2.0; Promega). A431 cells were seeded at 2.5k cells/well. After 24 h, cells were treated with PBS, cetuximab, or EGFR–REULR molecules as indicated using RNF167 (A5)-targeting nanobodies in combination with EGFR-binding moieties (7D12; 9G8) (50 nM). Cells were incubated for 72 h, washed, and subjected to CellTiter-Glo (2.0) assays to measure cell proliferation, according to the manufacturer’s specifications (Promega). Data are presented as a percentage of untreated cells (n = 4).

