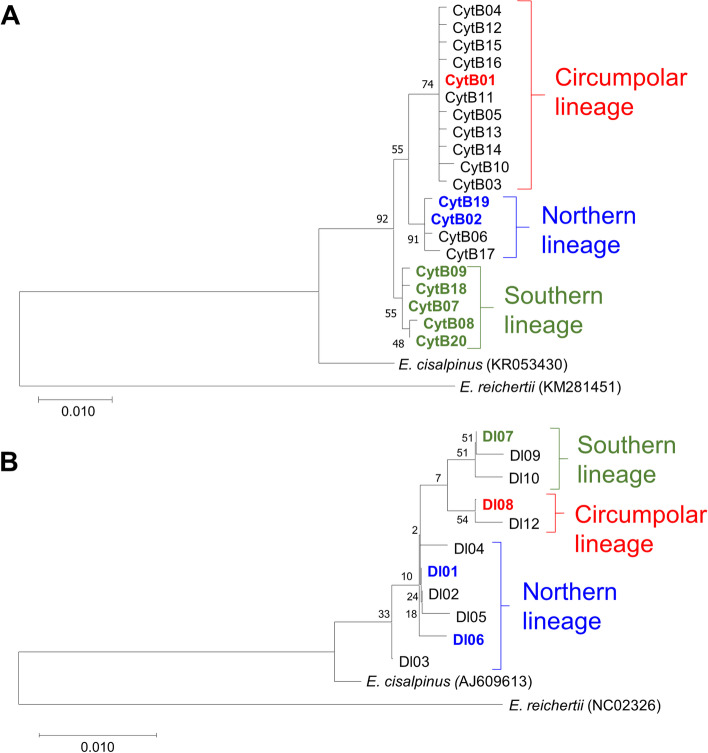
Fig. 1.
Evolutionary analysis of the indicated CytB (A) and D-loop (B) haplotypes by using the Maximum Likelihood method and Tamura-Nei model. The percentage of trees in which the associated taxa clustered together is shown next to the branches. The haplotypes appeared during our survey are highlighted by bold letter type. The lineage membership are shown by different colors (blue: Northern, red: Circumpolar, green: Southern). ML trees were built using E. reichertii and E. cisalpinus haplotypes as outgroup sequences, their Genbank accession numbers are indivcated in brackets. Colour figure online

