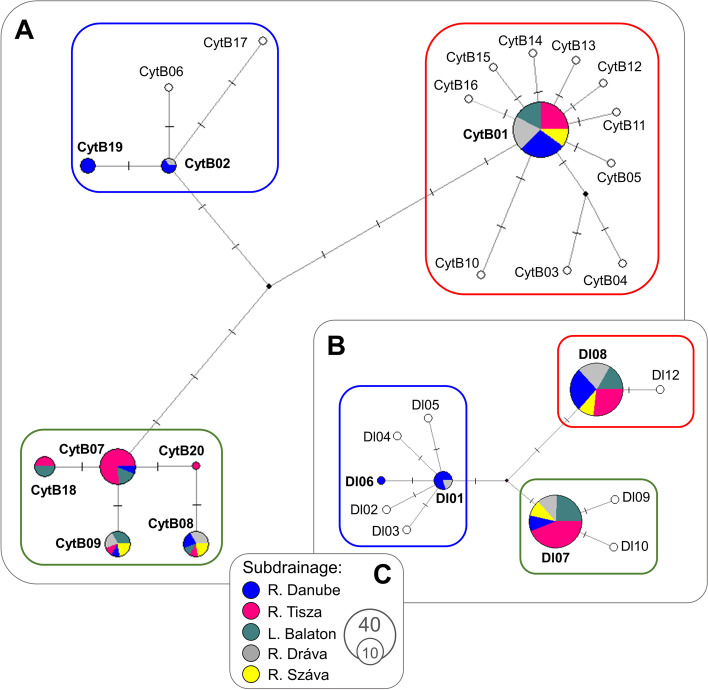
Fig. 2.
Median-Joining network of CytB (A) and D-loop (B) sequence data of the investigated 88 northern pike individuals. Line length refers to the genetic distances of haplotypes. Each vertical line is one mutation step. Small black circles represent missing or theoretical haplotypes. Haplotypes appeared from the study area marked by bold letter type. Haplotypes which were not indicated from the area are marked by white circles. The different lineages are emphasized with different coloured frames (blue: Northern, red: Circumpolar, green: Southern). The size and coloration of pie charts refer to the number of individuals carriing the certain haplotype and to their hydrographic origin (C). For more information see Table 1 and 2. Colour figure online

