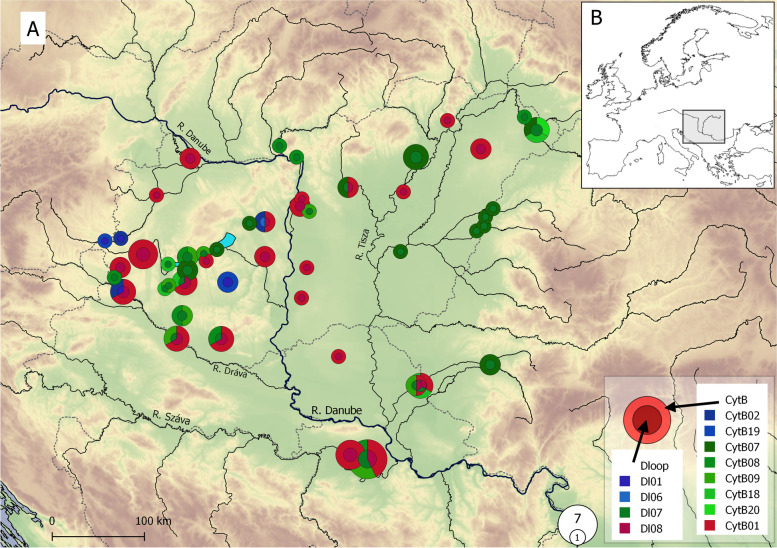
Fig. 3.
Distribution of the 49 sample sites in the inner area of the Carpathian Basin. (A) and the location of the studied area in Europe (B). The circles’ area corresponds with the number of the sampled individuals. The inner area and the frame of the circles show the D-loop and CytB haplotypes, respectively. The colors and shades of circles indicate their lineage membership (blue shades: Northern, red: Circumpolar, green: Southern). Country borders are shown by grey dotted lines. Base map was generated by QGIS software using layers freely available from European Environment Agency (EEA). Color online only

