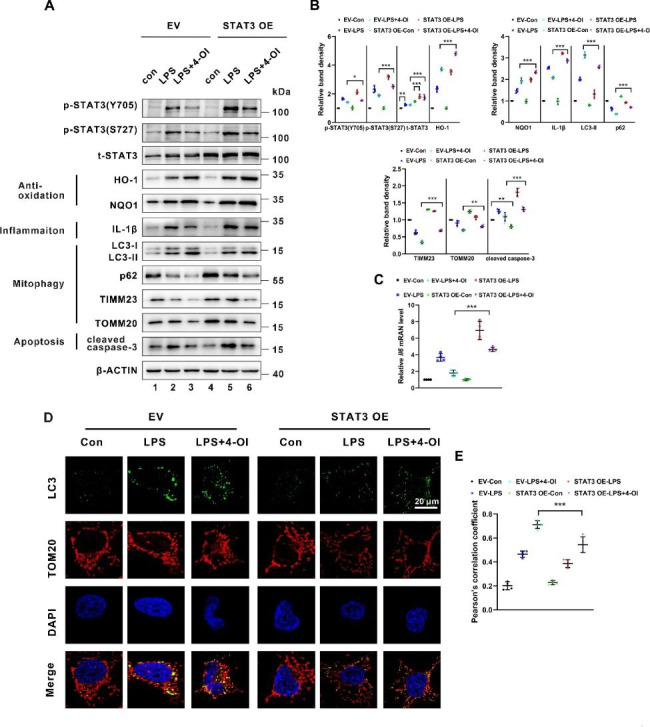
Fig. 6.

Transfection with STAT3 plasmid attenuated 4-OI-induced anti-inflammatory effect and mitophagy in BUMPT cells treated with LPS. (A) Representative western blot bands of p-STAT3 (Y705), p-STAT3 (S727), total STAT3, HO-1, NQO1, IL-1β, LC3B-II, p62, TOMM20, TIMM23, and cleaved caspase-3 in BUMPT cells (n = 4). (B) Relative band intensity of p-STAT3 (Y705), p-STAT3 (S727), total STAT3, NLRP3, HO-1, NQO1, p62, TOMM20, TIMM23, LC3-II and cleaved caspase-3 in BUMPT cells (n = 4). (C) qPCR analysis of mRNA of Il6 in BUMPT cells (n = 4). (D) BUMPT cells were immunostained with LC3B (green) and TOMM20 (red) to show mitophagy (n = 4). Scale bar: 20 μm. (E) Colocalization of LC3B and TOMM20 determined by Pearson’s correlation coefficient (n = 4). Each symbol (circle) represents an independent experiment. Data are presented as means ± SDs. *P < 0.05, **P < 0.01, ***P < 0.001; ns, not significant. EV, empty vector; STAT3 OE, STAT3 overexpression
