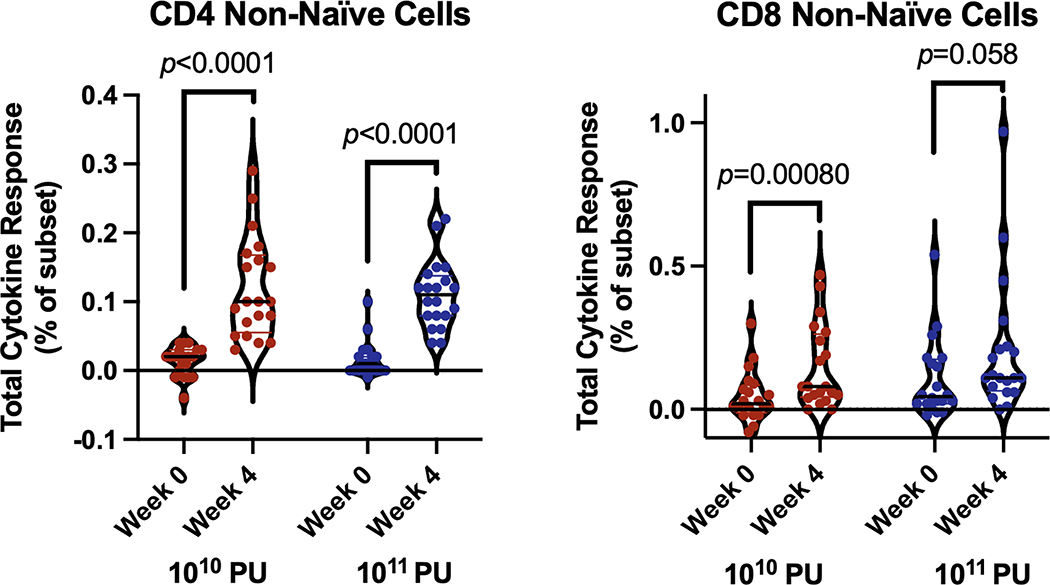
Figure 4: Frequency of Marburg glycoprotein-specific non-naive CD4 and CD8 T cells at baseline and at 4 weeks after vaccination.
Percentage of background-subtracted non-naive CD4 T cells or CD8 T cells producing any one of the three tested cytokines (interferon gamma, interleukin, and tumour necrosis factor) in response to Marburg glycoprotein peptide stimulation at baseline and 4 weeks post vaccination by dose group. Within each violin plot, the black line indicates the median and the coloured lines indicate the quartiles. n=20 per group at each timepoint. pu=particle units.

