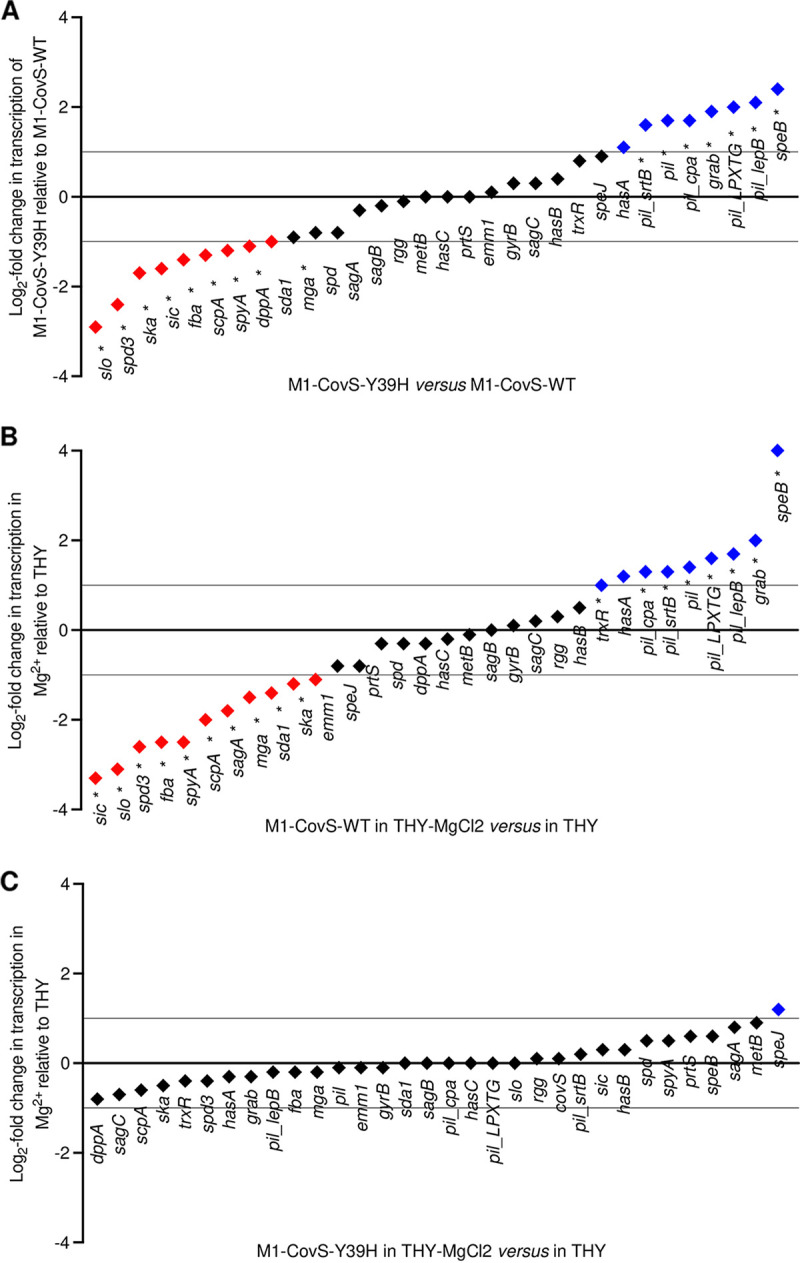
FIG 2.

The M1-CovS-Y39H strain displays an atypical transcriptomic profile and responds poorly to an environmental cue. Shown are log2 fold transcript differences in selected virulence genes between the M1-CovS-Y39H and M1-CovS-WT strains grown in THY broth (A), M1-CovS-WT grown in THY broth supplemented with MgCl2 and THY broth (B), and M1-CovS-Y39H grown in THY broth supplemented with MgCl2 and THY broth (C), as determined by RNA-seq analysis (see Table S2 in the supplemental material). Genes are in black; those that are overexpressed and underexpressed are highlighted with a blue diamond above the zero bar and a red diamond below the zero bar, respectively. *, statistically significant after a multiple-testing-adjustment procedure.
