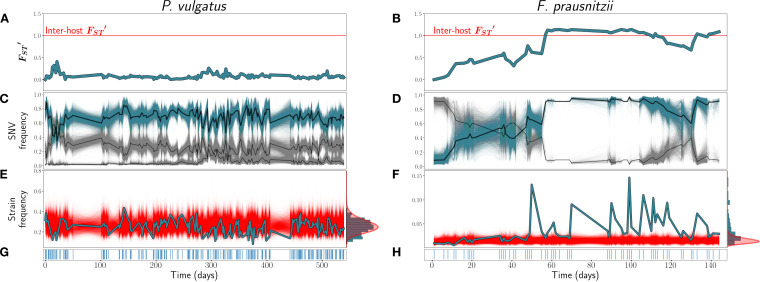
FIG 1.
(A and B) trajectories for P. vulgatus (host am) (A) and F. prausnitzii (host ao) (B). (C and D) SNV frequencies of three inferred strains for P. vulgatus (C) and two inferred strains for F. prausnitzii (D). In black are the inferred strain trajectories. Highlighted in blue are example strains featured further in panels E and F. (E and F) Frequencies of the example strains in blue, with simulations of the corresponding SLM overlaid in red. At the right, the empirical distribution of strain abundances is plotted in blue, and the stationary gamma distribution of abundances (see equation 2) predicted by the SLM is in red. (G and H) Sampling time points. Blue lines indicate that a sample was taken on that day.

