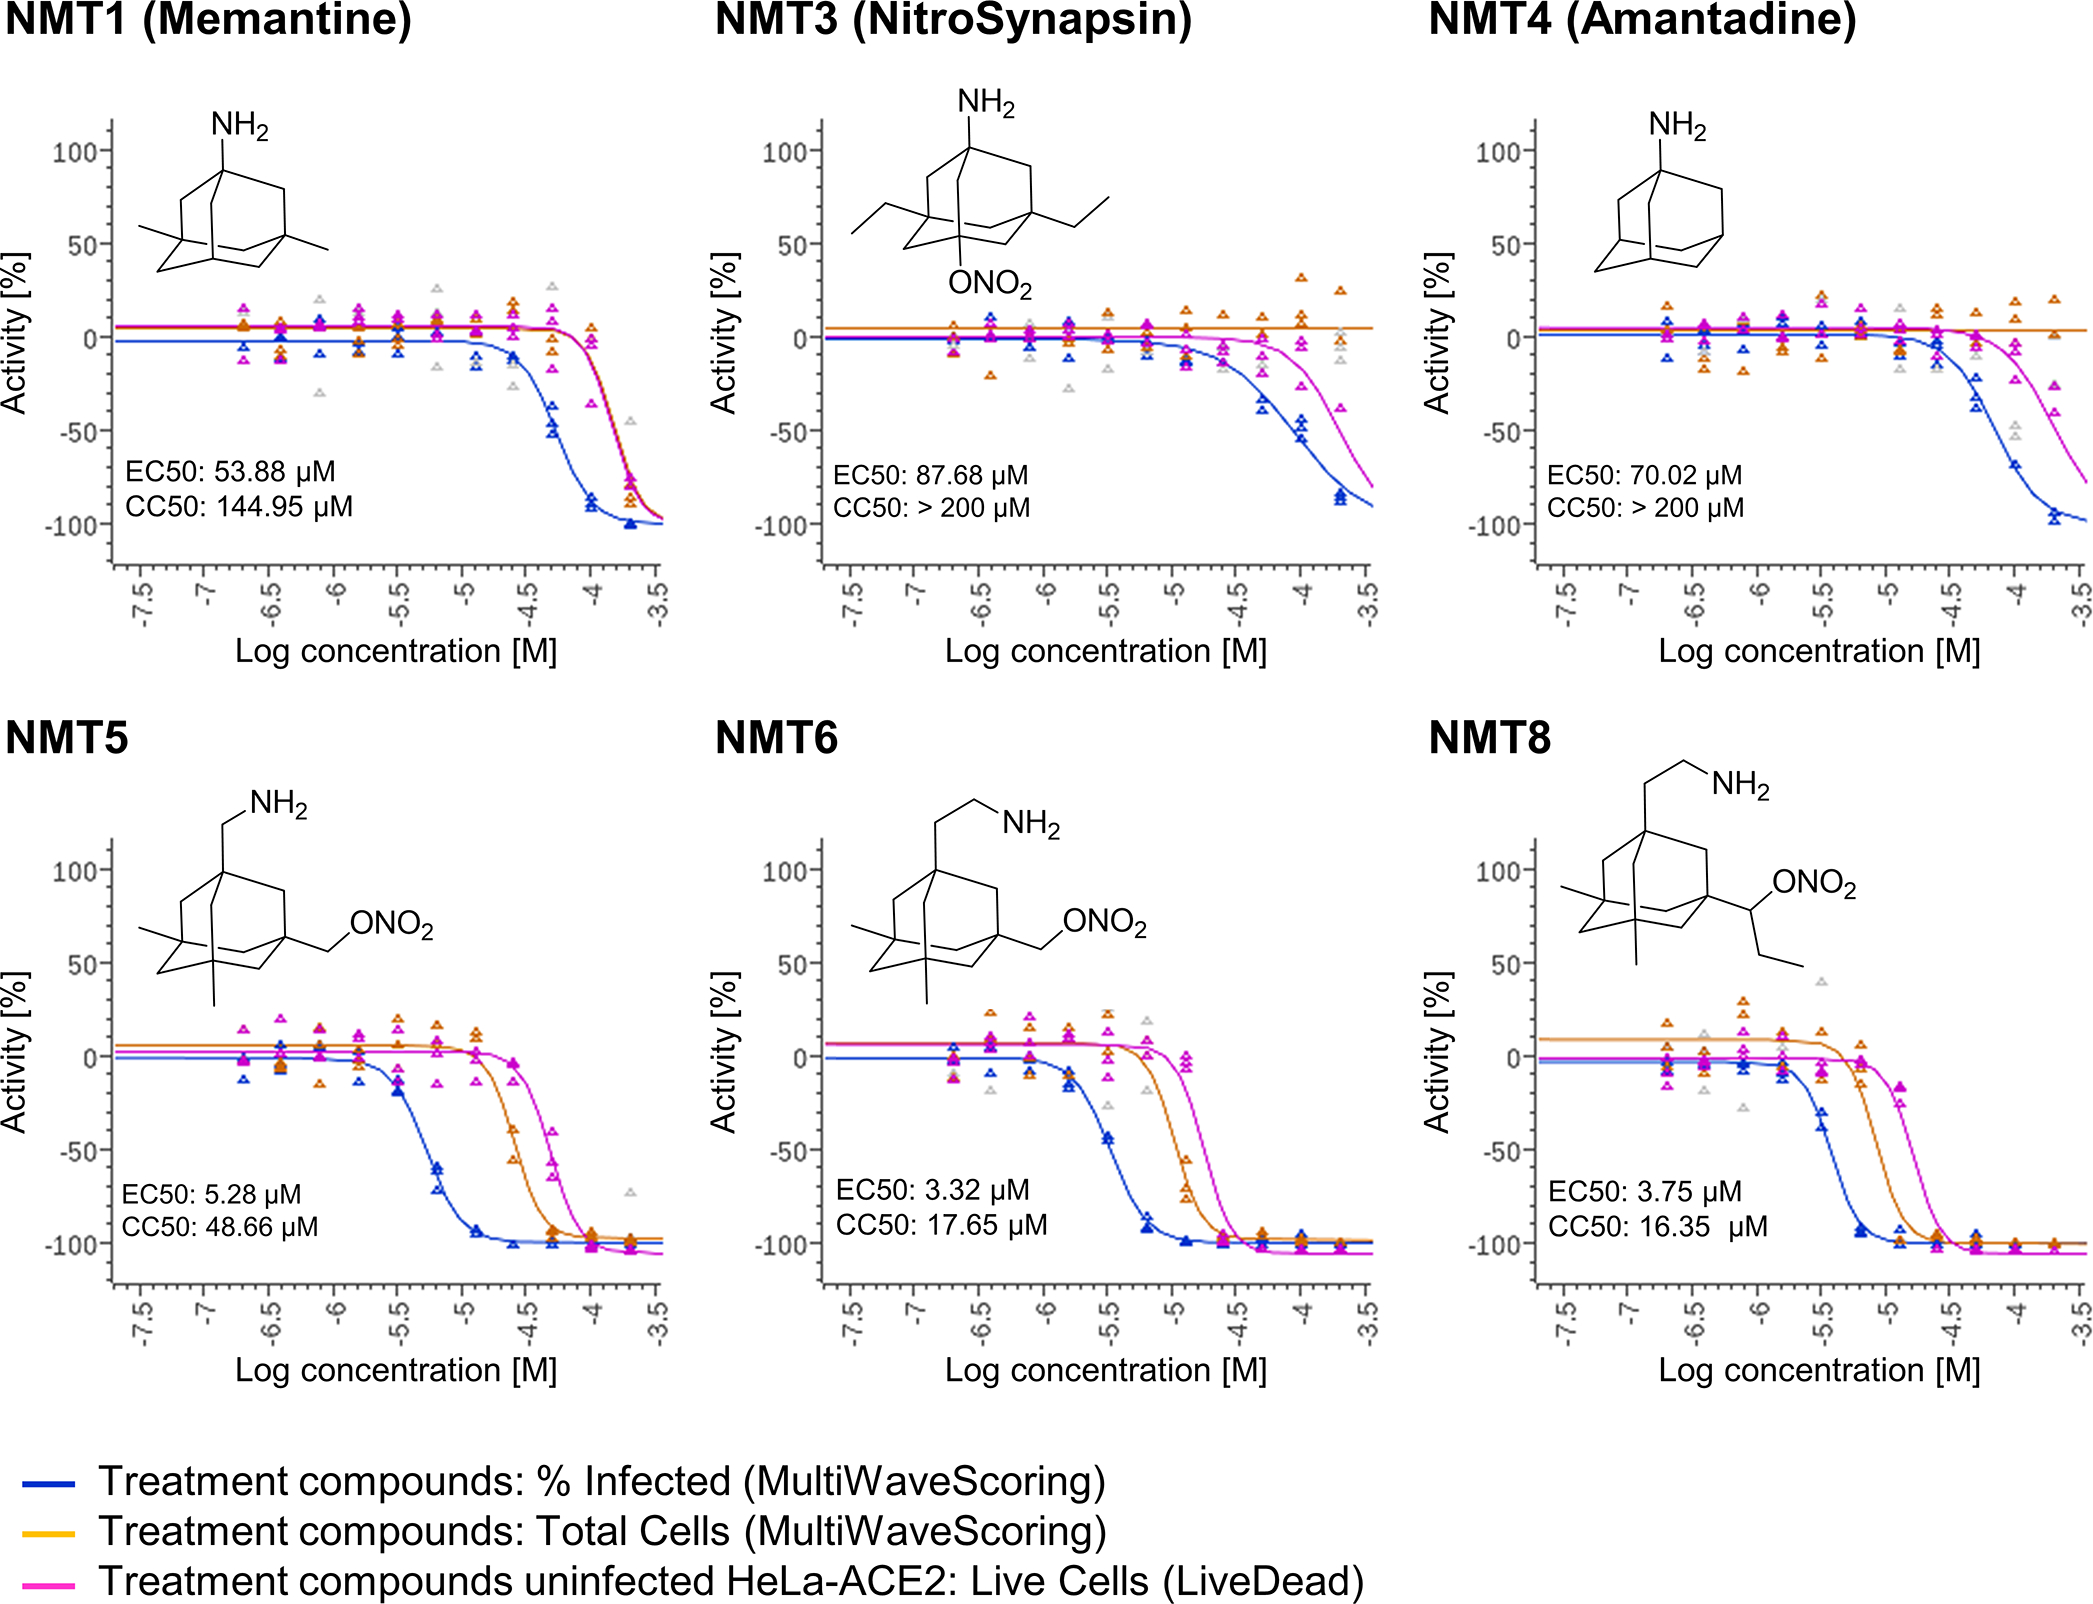
Fig. 2 |. Dose-response of drugs screened against SARS-CoV-2.

Dose-response curves showing the EC50 of each compound against SARS-CoV-2 (% infected cells, blue), total cell counts (orange) in the infection experiment and the CC50 for uninfected host cell toxicity (magenta), as assessed in HeLa-ACE2 cells. See also Supplementary Data Set 1 for full dataset.
