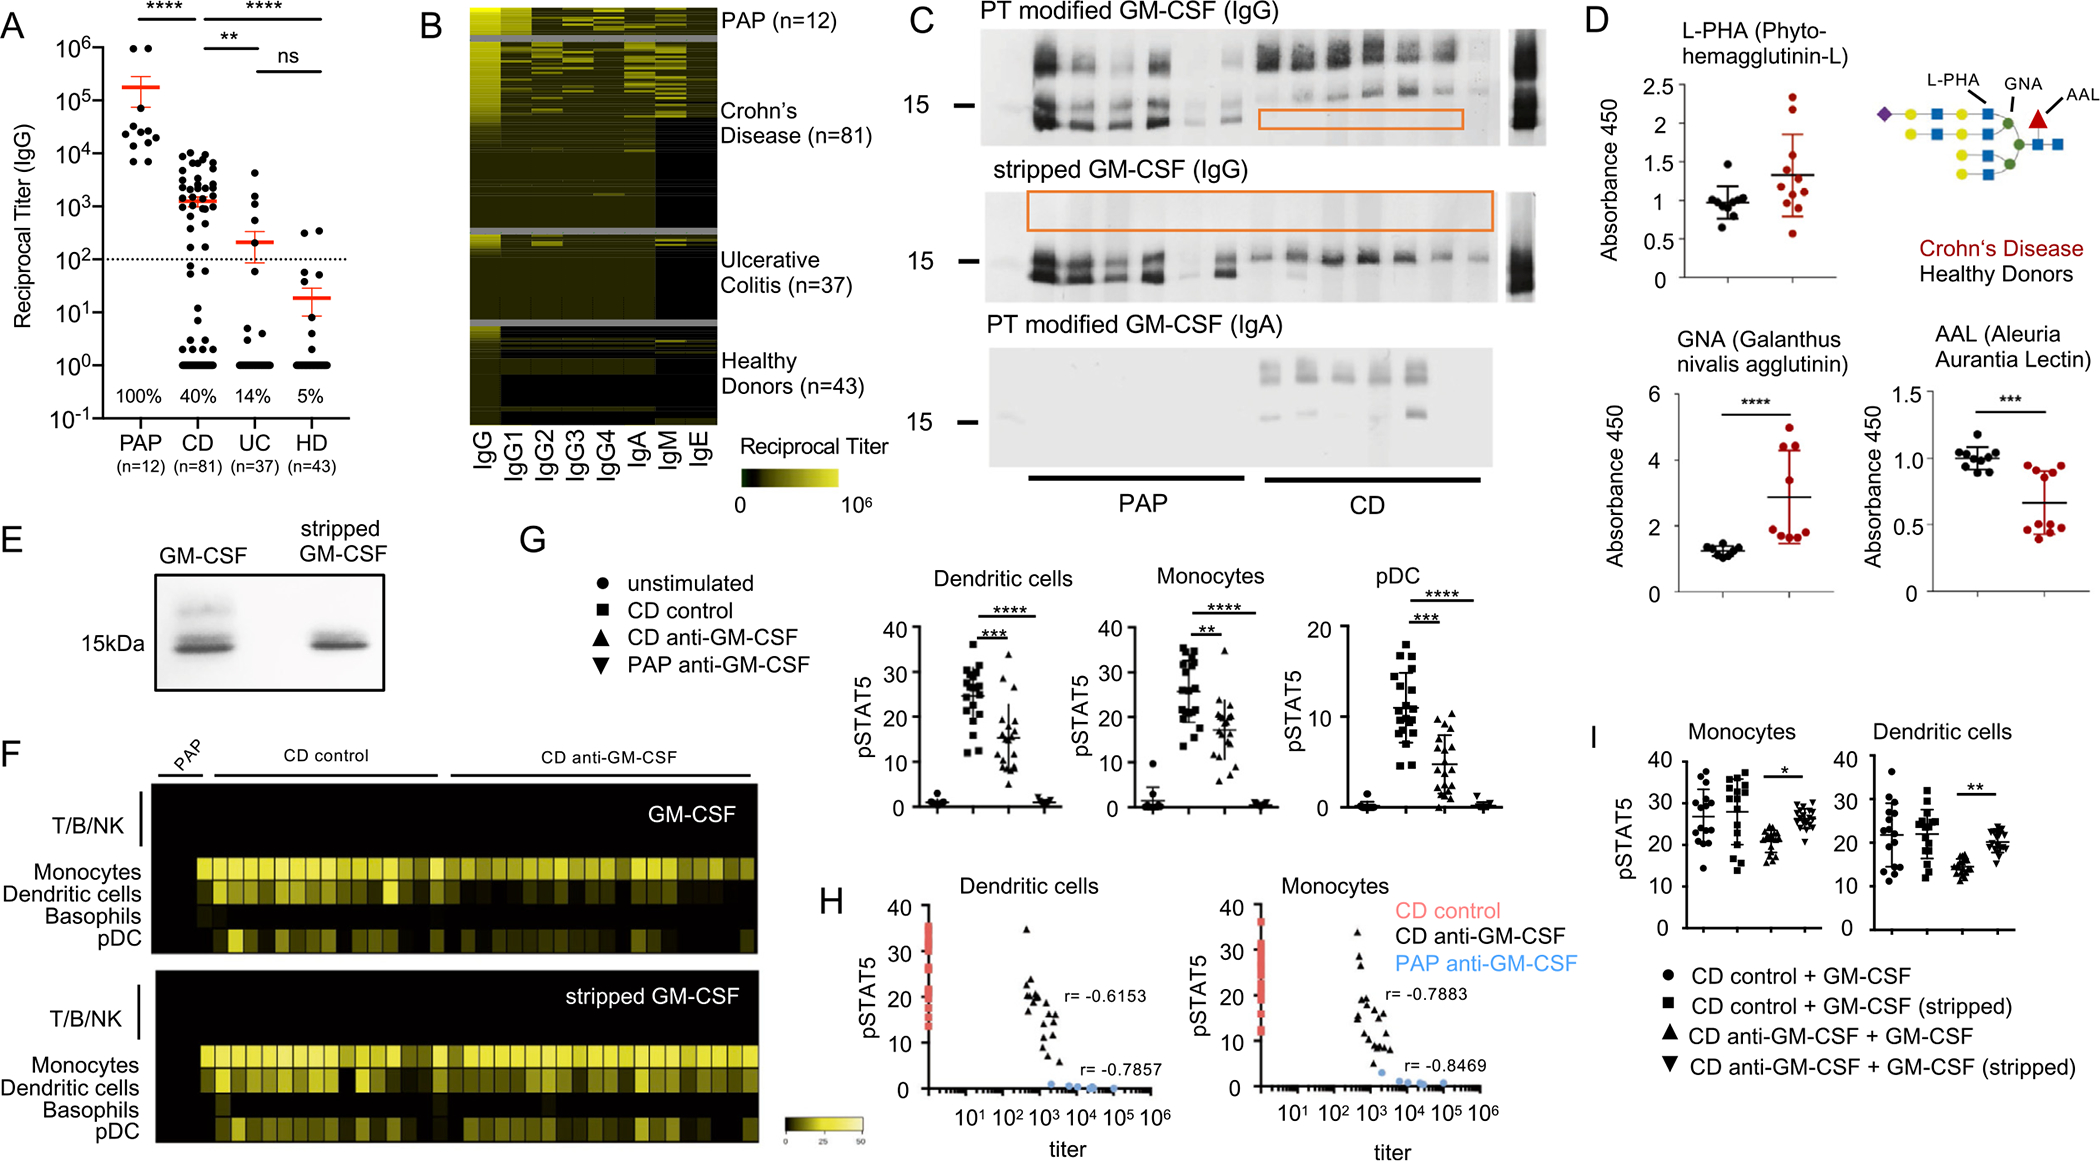
Figure 1.

Characterization of aGMAb in patients with CD. (A) Reciprocal titers for total serum IgG aGMAb in sera of HD, patients with PAP, patients with CD, and patients with UC. (B) Isotype profiles of aGMAb in patients with PAP and patients with CD. Horizontal rows represent patients and vertical rows indicate isotypes. (C) Western blots probed with polyclonal sera from patients with CD and PAP show binding of anti-GM-CSF IgG and IgA to glycosylated (post-translationally-modified) and stripped GM-CSF. (D) Levels of GNA, AAL, and L-PHA binding to GM-CSF from HDs (black) and patients with CD (red), normalized for the total levels of GM-CSF in each sample. Schematic representation of N-glycan highlighting lectin recognition. (E) Native polyacrylamide gel electrophoresis of GM-CSF (sargramostim) and stripped GM-CSF stained with Coomassie Brilliant Blue. (F) Heat maps of pSTAT5 signal in peripheral blood mononuclear cells after stimulation with glycosylated (top) or deglycosylated GM-CSF in the presence of PAP serum, aGMAb− CD serum, or aGMAb+ CD serum. Heat maps show signal intensity of anti-pSTAT5 staining in yellow code for individual patients (lanes) within the indicated cell populations identified using mass cytometry (rows). (G) Plots show quantification of pSTAT5 signal in DCs, monocytes, and plasmacytoid DCs either unstimulated or stimulated with GM-CSF preincubated with serum from the indicated patient groups. (H) Loss in pSTAT5 correlates with aGMAb titers. (I) Quantification of pSTAT signal for monocytes and DC shown in (F). One-way analysis of variance (ANOVA) Bonferroni’s multiple comparison test was performed. Mann-Whitney test. *P-value <.05.
