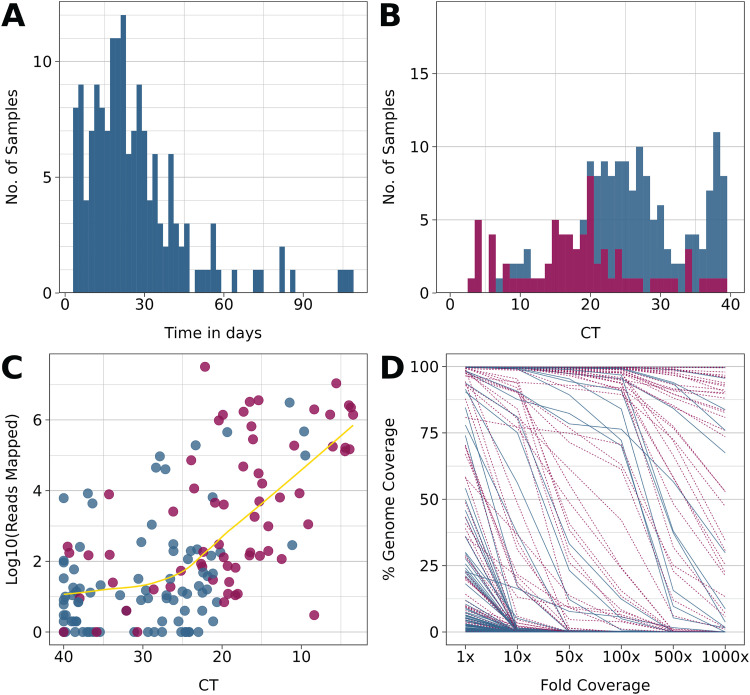
FIG 1.
Summary characteristics of the cohort and sequencing performance. Red indicates values at baseline (T0), and blue indicates subsequent sampling points. (A) Distribution of observation time for the cohort. (B) Distribution of viral genome copy number as determined by real-time RT-qPCR. This excludes n = 60 samples for which no CT values were available, only a negative/positive determination. (C) Relation between genome copy number as determined by real-time RT-qPCR and fraction of reads mapped/total reads. (D) Relation between the fraction of reads mapped/total reads and coverage at 1×, 10×, and 100×.

