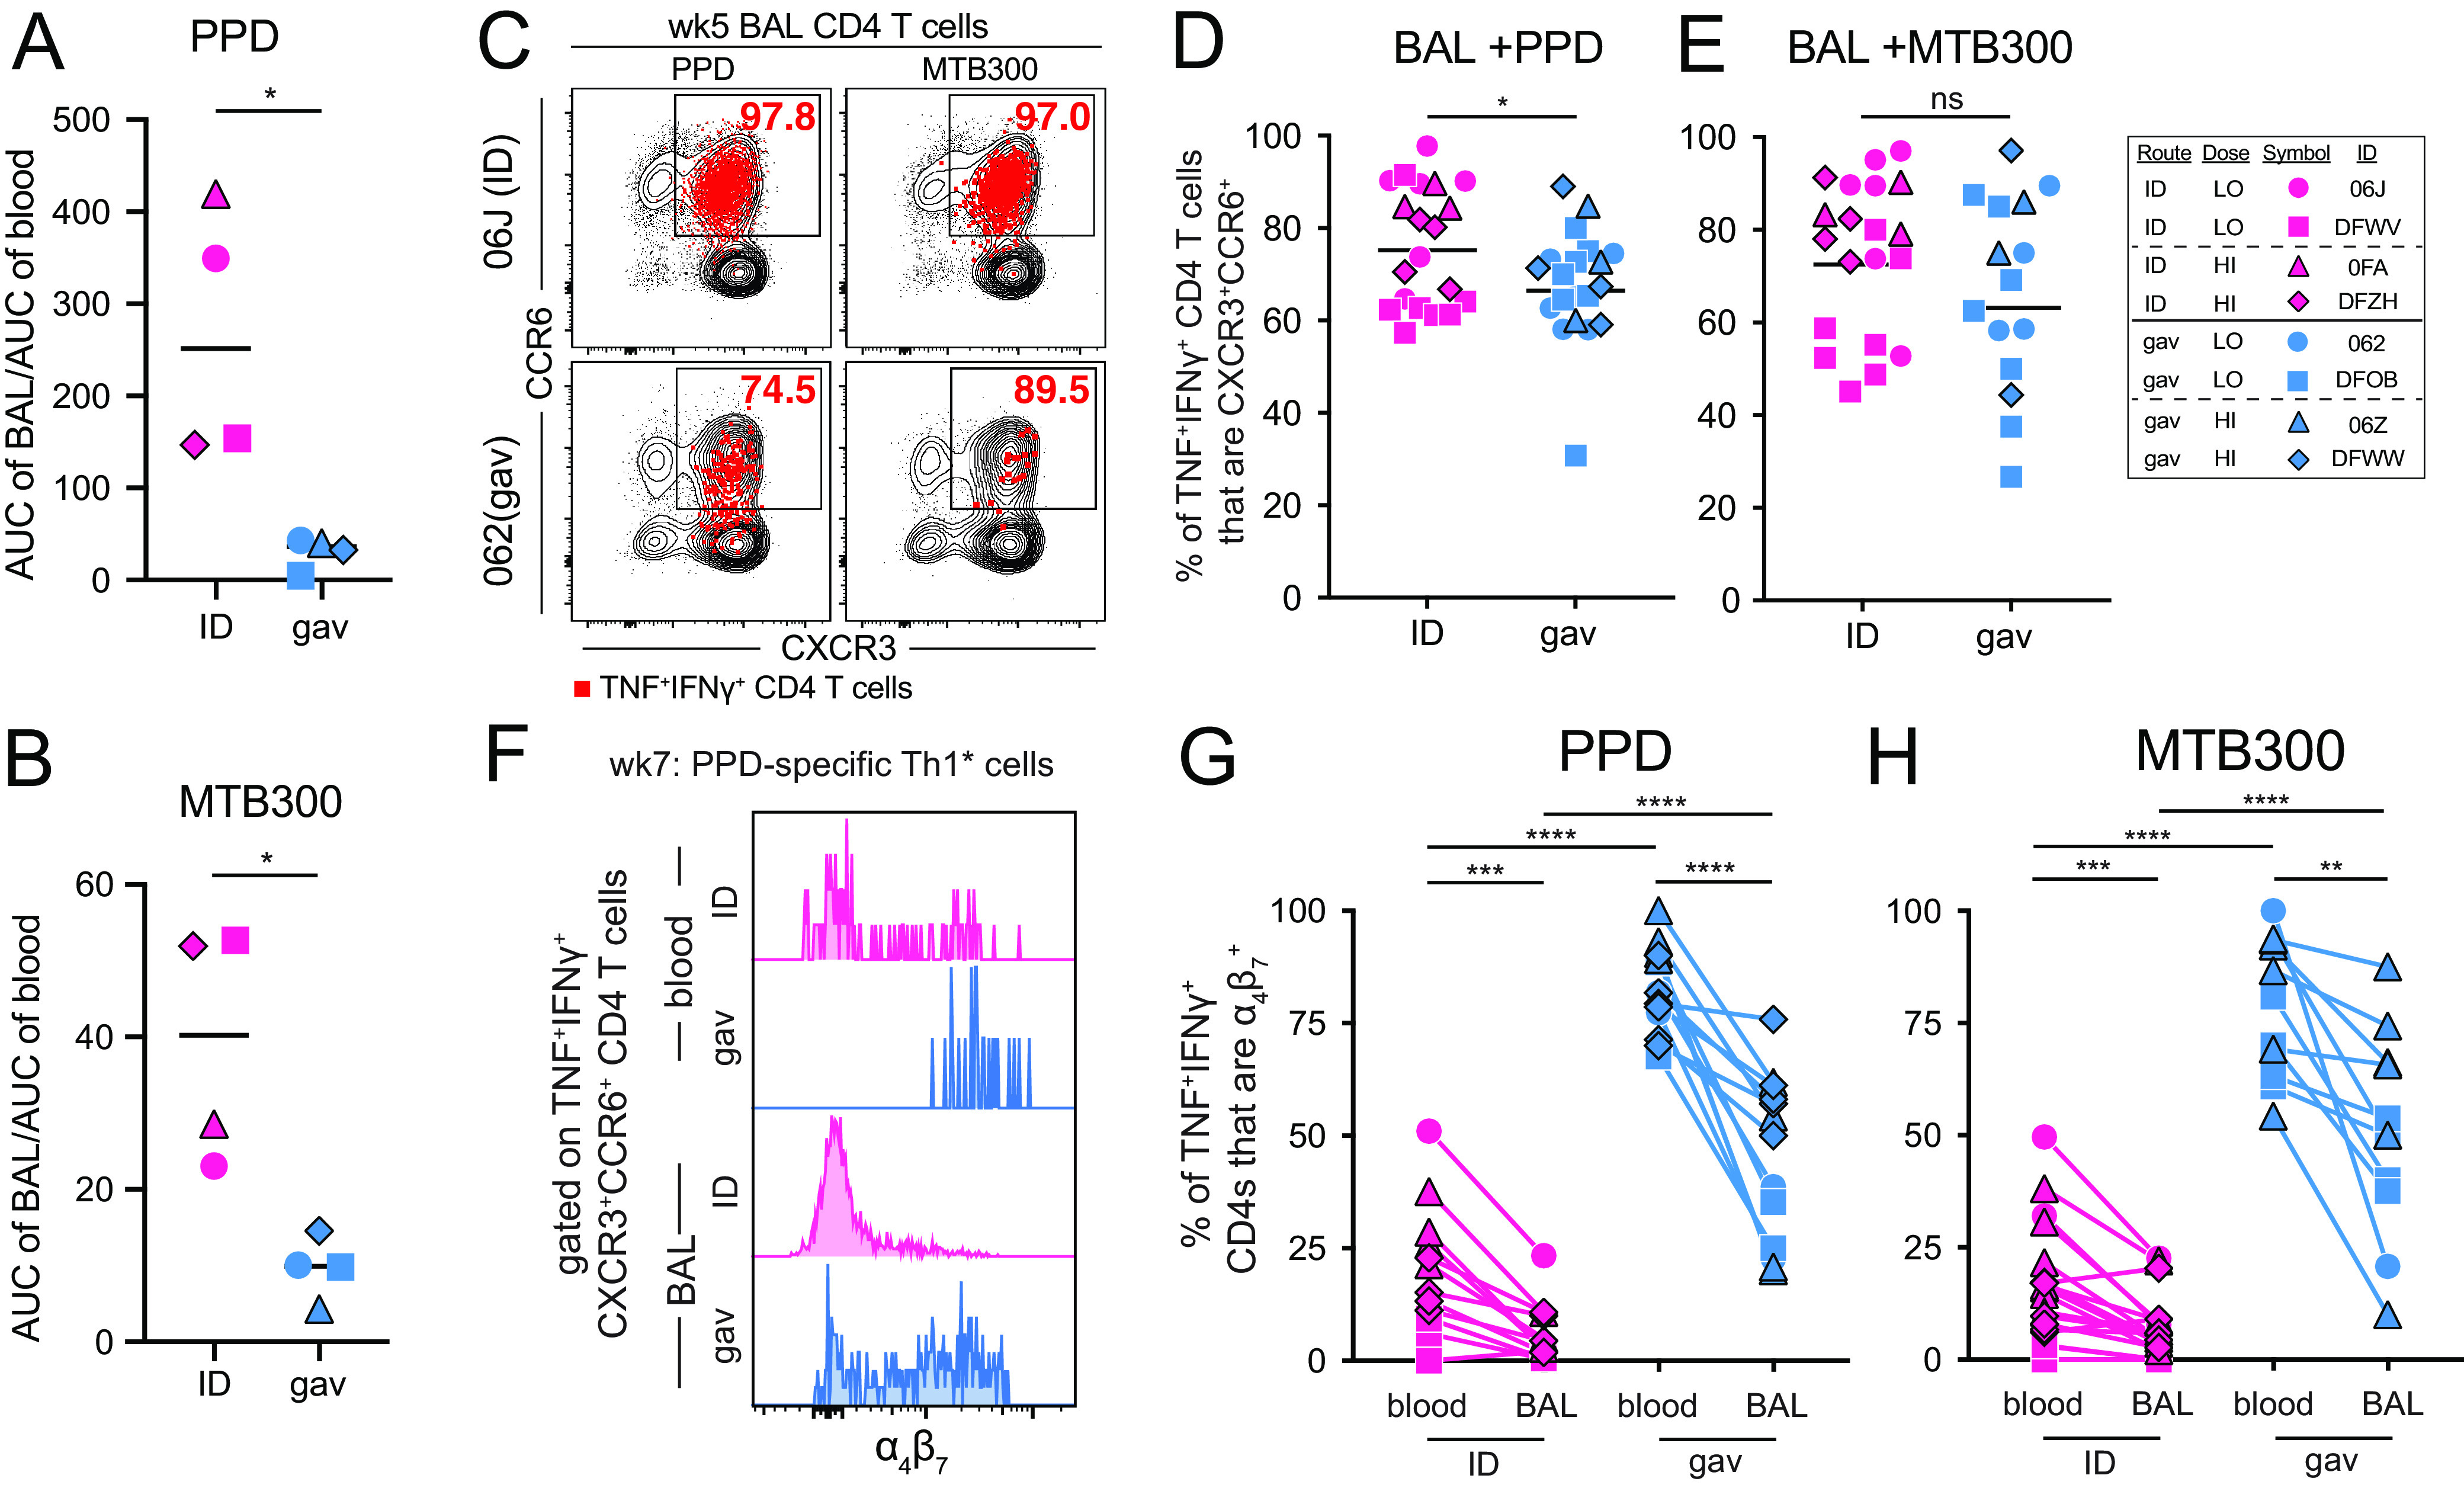
FIG 3.

Gavage BCG vaccination induces gut-homing receptors on Ag-specific Th1* cells. (A and B) Ratio of the AUC of BAL TNF+ CD4 T cells to blood TNF+ CD4 T cells, as shown in Fig. 1C to F, following in vitro restimulation with either PPD (A) or MTB300 (B). (C) Example FACS plots showing CCR6 and CXCR3 staining in BAL CD4 T cells from week 5 postvaccination. Bulk CD4 T cells are shown in black, and red overlay depicts TNF+IFNγ+ CD4 T cells. (D and E) Graphs showing percentage of BAL TNF+IFNγ+ CD4 T cells that are CCR6+CXCR3+ from all time points postvaccination combined into 1 column, following either PPD (D) or MTB300 (E) stimulation. (F) Example histogram of α4β7 staining on CCR6+CXCR3+ BAL and blood CD4 T cells from week 7 postinfection. (G and H) Graphs showing percentage of TNF+IFNγ+ CD4 T cells that are α4β7+ following either PPD (G) or MTB300 (H) restimulation. Graphs show multiple time points combined into a single column with a line drawn to identical time points in the second tissue. A paired t test was used for this comparison, whereas an unpaired t test was used to compare identical tissues across vaccination groups. *, P < 0.05; **, P < 0.01; ***, P < 0.001; and ****, P < 0.0001.
