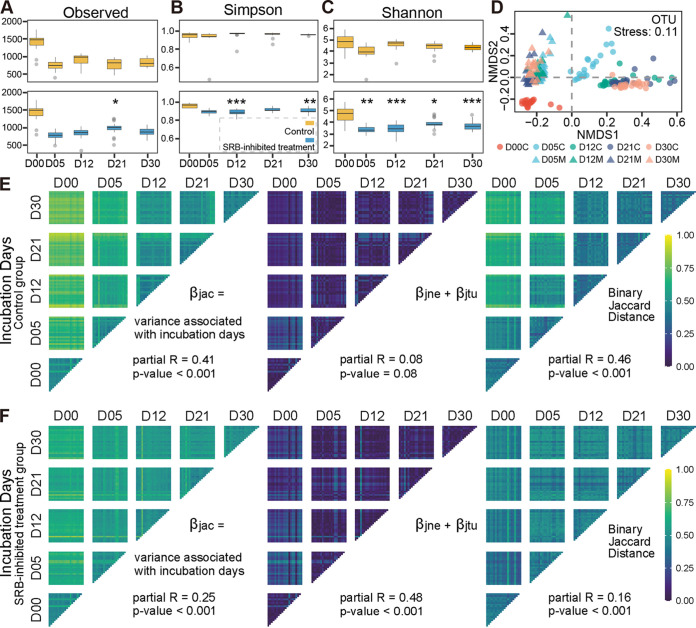
FIG 2.
Characterization of bacterial community biodiversity. (A to C) The alpha diversities (observed OTU number [A], Simpson index [B], and Shannon-Wiener index [C]), along with incubation days, both in the control and SRB-inhibited treatment groups, were calculated. Orange and blue represent the control and SRB-inhibited treatment groups, respectively. D00, D05, D12, D21, and D30 on the x axis represent 0, 5, 12, 21, and 30 days of incubation. The results of ANOVA with Turkey’s HSD tests between the control and SRB-inhibited treatment groups at the same incubation days are shown; *, 0.01 < P ≤ 0.05; **, 0.001 < P ≤ 0.01; and ***, P ≤ 0.001. (D) Beta diversity of the bacterial community visualized using NMDS ordination based on the binary Jaccard distance. Circle and triangle symbols represent the control and SRB-inhibited treatment groups, respectively. (E and F) Binary Jaccard distance between samples, partitioned by contributions from nestedness (species loss) and turnover (species replacement). The total change (βjac) is the sum of changes due to nestedness (βjne) and turnover (βjtu).

