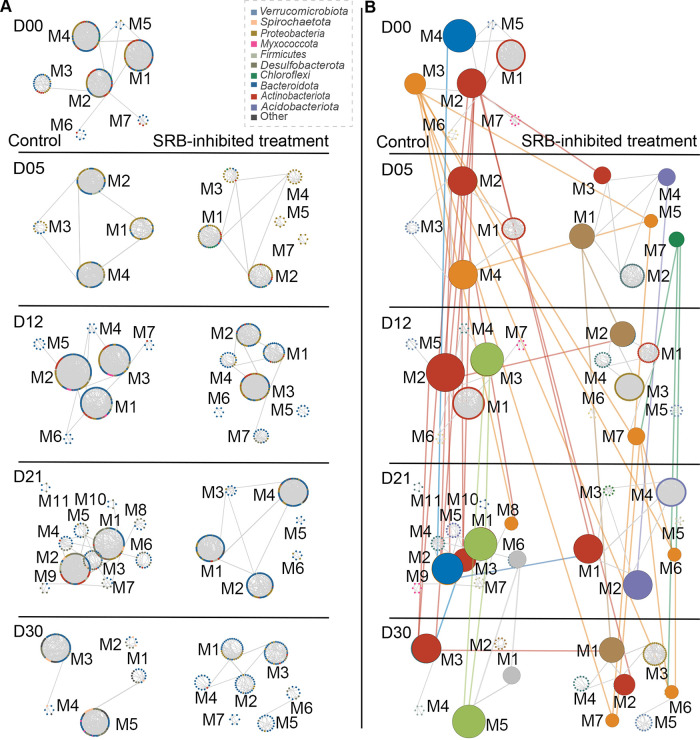
FIG 3.
Preserved modules of networks across incubation days. (A) Modules (≥5 nodes) shown in circular layout for all networks. The nodes indicate major taxa and are colored randomly based on the different phyla. The label represents the ID of the module. The left column represents modules in the control group, and the right column represents modules in the SRB-inhibited treatment group. (B) Preserved module pairs are connected and highlighted. Nodes are randomly colored based on the modules. The left column represents modules in the control group, and the right column represents modules in the SRB-inhibited treatment group. The vertical links in the same color indicate that the linked modules were part of the same module clusters. The horizontal links indicate that the linked modules of the control and SRB-inhibited treatment networks at the same enrichment incubation stage were preserved. Note that three clusters of modules (the red, blue, and orange clusters) were consistently preserved over the course of the incubation from D00 (day 0) to D30 (day 30). D00, D05, D12, D21, and D30 represent 0, 5, 12, 21, and 30 days of incubation, respectively. The nodes both in panels A and B only represent different taxa rather than the relative abundance.

