FIG 6.
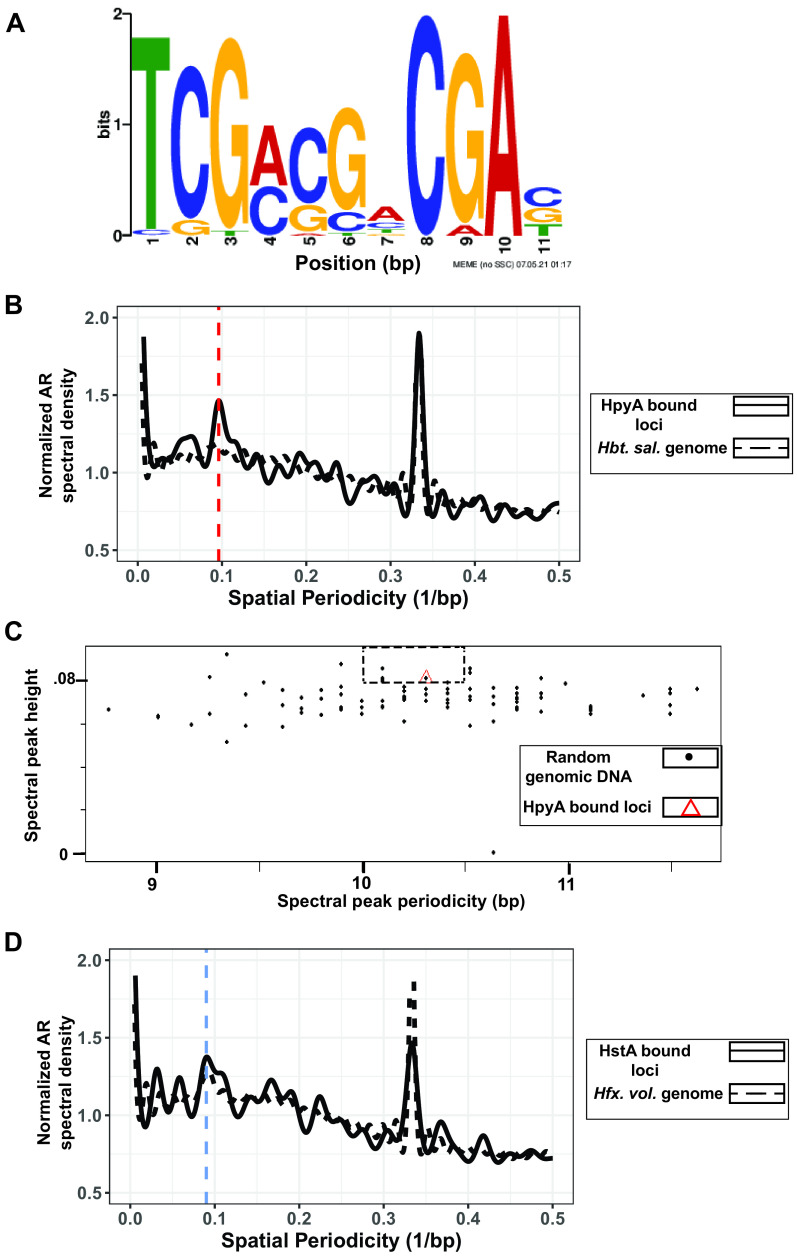
Sequence specificity of HpyA and HstA binding. (A) Motif logo of cis-regulatory sequence detected in HstA-bound sites. Bit scores are shown on the y axis and base pair positions on the x axis. Motif logo generated by the MEME suite output (46). (B) The 10.4-bp periodicity is present in HpyA-bound loci (solid black line) but absent in the Hbt. salinarum genome (dashed black line). The vertical red dashed line indicates 10 bp. (C) Comparing randomly chosen regions of the genome (black dots) with the periodicity of the HpyA-bound loci (red triangle). The dashed rectangle includes those randomly chosen sequences that show stronger periodicity than HpyA at relevant levels (10 to 10.5 bp). (D) The ~11-bp frequency of HstA-bound loci (black solid line) matches the periodicity of the entire genome of Hfx. volcanii (black dashed line). The blue dashed line indicates 11 bp.

