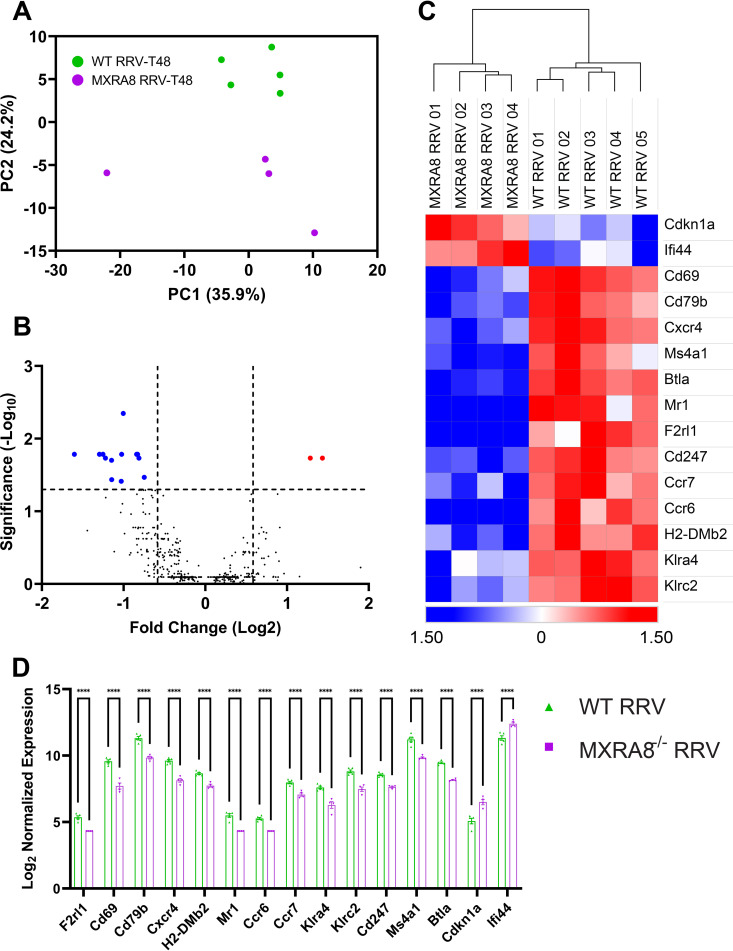
FIG 6.
Cdkn1a and Ifi44 were upregulated in the blood of RRV-infected MXRA8−/− mice. WT and MXRA8−/− mice were infected with RRV at 104 PFU. Sera were harvested from infected mice at 7 dpi. (A) PCA clustering between WT and MXRA8−/− RRV-infected mice. (B and C) Volcano plot (B) and heatmap (C) of gene expression data. The data are normalized to hypoxanthine phosphoribosyltransferase (HRPT), and the differential expression is shown as the Z-score. Red dots indicate significantly increased expression of genes, and blue dots indicate significantly decreased expression of genes. (D) Comparison of genes, plotted as a bar graph. Dots represent individual animals (n = 4 to 5). The data are presented as means ± the SEM. *, P < 0.05; **, P < 0.01; ***, P < 0.001; ****, P < 0.0001 (using two-way ANOVA with the Šídák posttest; ns, not significant).

