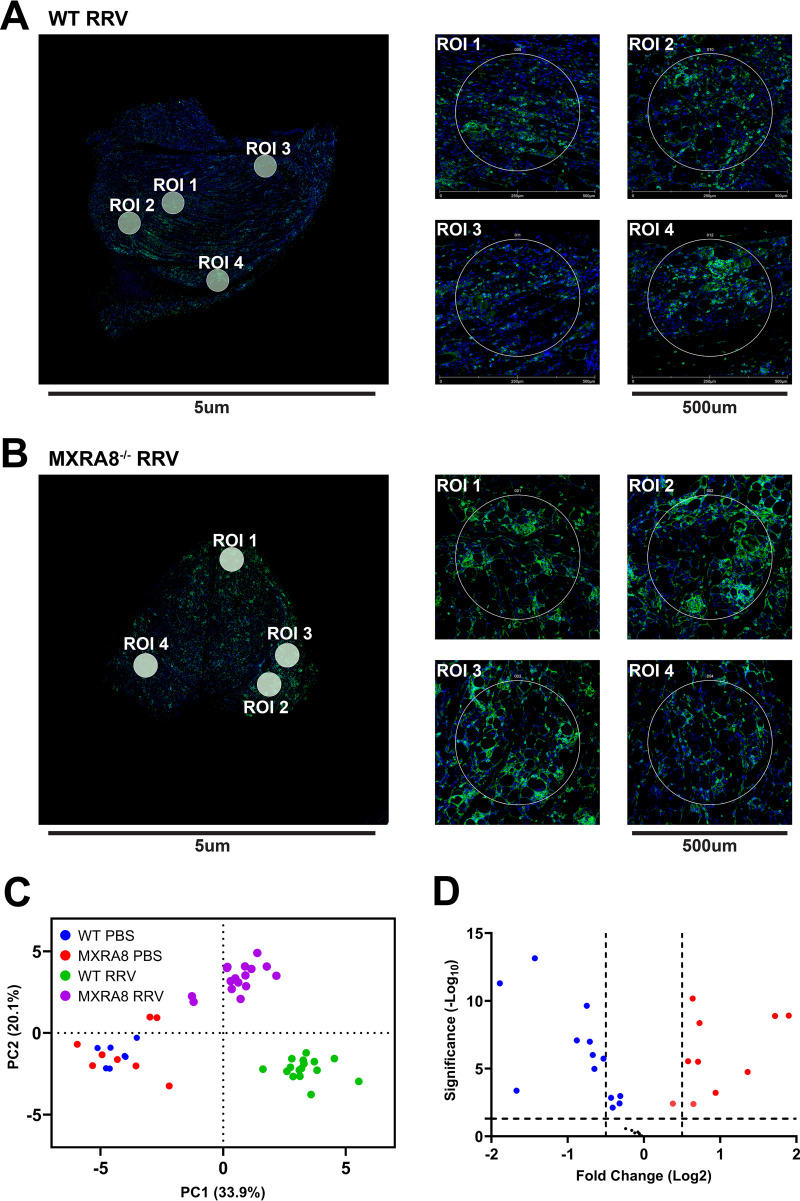
FIG 7.
Immune transcriptional profile of RRV-infected MXRA8−/− mice. WT and MXRA8−/− mice were infected with RRV at 104 PFU or mock infected with PBS. Quadriceps were harvested from infected mice at 10 dpi. Gene transcription profiles were analyzed using R. (A and B) Representative images of WT (A) and MXRA8−/− RRV-infected (B) mice (n = 4 mice per group; two ROIs were selected from the mock-infected group [data not shown], and four ROIs were selected from the RRV-infected group). (C) PCA clustering between WT and MXRA8−/− mock and RRV-infected mice. (D) Volcano plot of gene expression data. Red dots indicate significant increases in the fold change of genes, and blue dots indicates significant decreases in the fold change of genes. The samples are normalized to a WT control group.

