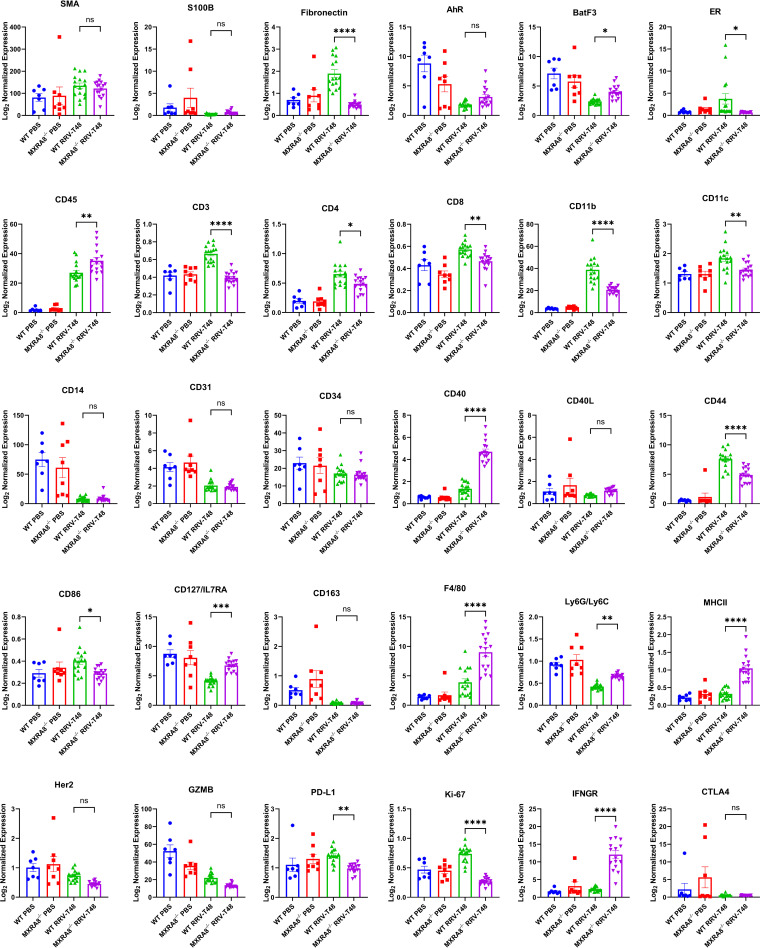
FIG 8.
DSP spatial profile of RRV-infected WT and MXRA8−/− mice. WT and MXRA8−/− mice were infected with RRV at 104 PFU or mock-infected with PBS. Quadriceps were harvested from WT and MXRA8−/− mock- or RRV-infected mice at 10 dpi. Gene transcription profiles were analyzed using R. Differences in gene expression were plotted out in bar graphs. The data are normalized to a WT control group. Dots represents individual ROIs (n = 7, 8, or 16). The data are presented as means ± the SEM. *, P < 0.05; **, P < 0.01; ***, P < 0.001; ****, P < 0.0001 (using two-way ANOVA with the Tukey’s posttest; ns, not significant).

