FIG 3.
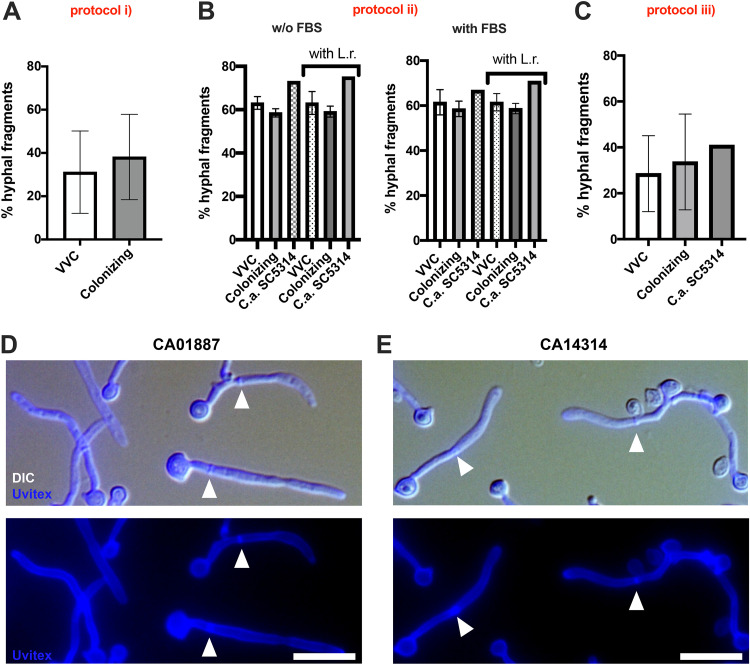
C. albicans hyphal fragment production. Data in the graphs show the mean percentage ± standard deviation (SD) of hyphal fragments produced by VVC and colonizing C. albicans strains after 24 h of culture in RPMI 1640 (protocol i) (A), in RPMI or RPMI plus 10% FCS in the presence or absence of Lactobacillus rhamnosus (L.r.) (protocol ii) (B), or during infection of a monolayer of A431 cells (protocol iii) (C). Statistical analysis was performed according to Student's t test (A and C) and Kruskal-Wallis test, followed by Dunn’s multiple-comparison test or one-way ANOVA, followed by Tukey’s multiple-comparison test (left and right graphs of panel B, respectively). Panels D and E show representative images of hyphal segments from the 01887 (D) and 14314 (E) strains from experimental protocol ii, grown in sgRPMI. Arrowheads indicate the septa separating one hyphal segment from another. The data come from at least 3 biological replicates.

